The changing American age curve of divorce

The incidence of divorce, like the incidence of many other demographic phenomena, varies greatly across the life course. Divorce is most prevalent during young adulthood and relatively infrequent among the elderly, a pattern that has been present for at least a century. In contrast, the overall level of divorce in the U.S. has varied substantially over time, with a long-term upward trend but with notable deviations from that trend. It is not surprising then that most discussions about divorce have focused on its overall level rather than on how it varies across the life course. This is unfortunate insofar as it leads us to overlook that fact that, in the U.S. at least, recent years have seen the relationship between the prevalence of divorce and age weaken substantially.
The age curve of divorce since 1970
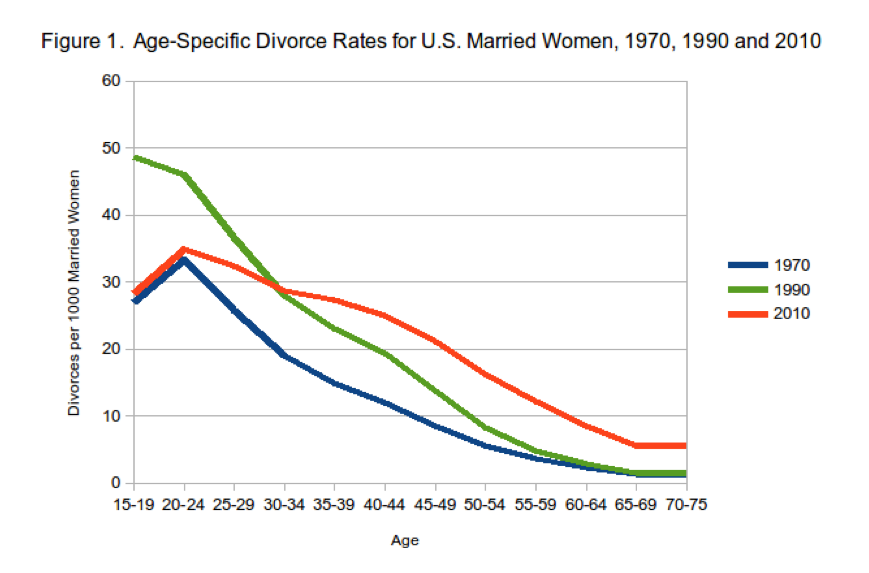
The clearest depiction of the relationship between age and divorce during a given year is a graph showing the age-specific divorce rates of married women for different age groups during that year. The line in such a graph represents the “age curve of divorce” for that year. Figure 1 shows the age curves of divorce for American married women for three years: 1970, a year in the early stages of the U.S. “divorce revolution”; 1990, a year of historically high divorce rates; and 2010, a recent year for which we have reliable data (Kennedy and Ruggles, 2014).¹ Focusing first on the 1970 and 1990 curves, we see that at all ages the age specific divorce rates for 1990 are higher than those for 1970, and that this was especially true for the younger age categories (the small differences for the oldest ages are indistinguishable in this graph). In addition, the age-specific rates for these two years rapidly fall after hitting their peaks (33 per thousand for those 20 to 24 years old in 1970, and 49 for those 15 to 19 years old in 1990). In comparison, the 2010 divorce curve falls more slowly from its peak (35 for ages 20-24) than the 1970 and 1990 divorce curves do.
We can measure the differences between the downward trajectories of these three divorce curves by taking advantage of the fact that all three curves are roughly linear between the 20-24 and the 50-54 age categories. As a result, we can estimate the rate of decline for each curve by dividing the difference between the 20-24 and the 50-54 age-specific divorce rates by thirty, the number of years between those two categories. This gives us -0.9 for the 1970 divorce curve, indicating that in 1970 each additional year of age was associated with 0.9 fewer divorces per 1000 married women. The corresponding results for 1990 and 2010 are, respectively, -1.3 and -0.6.² Thus, we can conclude that the 2010 rate of decline in the age-specific divorce rates across the 20-24 to 50-54 age groups was about two-thirds of 1970’s rate of decline and half of 1990’s.
The slower decline in the age curve of divorce for 2010 is associated with two notable phenomena. First, because the rates in the highest age categories were very low until recently, current rates for those ages are multiples of the previous rates for those categories. For example, the 2010 rate for women between 50 and 54 is double the 1990 rate for that age group, and the 2010 rate for women 65 and older is almost four times the 1990 rate for that group. Although these large proportional increases have led some to portray the higher levels of divorce in recent years as being especially characteristic of women aged 50 and above (Brown and Lin, 2012), when we shift our attention from proportional increases to the absolute sizes of the increases it is clear that there have been increases of similar magnitude among all women aged 35 and above.
Second, even though the 1990 age-specific divorce rates were among the highest ever recorded for American women, the 2010 rates exceeded them for every age category above the 25-29 category. In fact, if we sum the age-specific rates across all of the ages represented in the figure above, we find that the sum for 2010 equals 1.23 while that for 1990 equals 1.17.³ Thus, even though the 2010 age-specific divorce rates for the youngest two age categories are much lower than their corresponding rates for 1990, the higher rates for the older age categories outweigh them, and signal that the overall propensity of American married women to divorce in 2010 was slightly higher than it was in 1990.4
Concluding observations
The flattening of the age curve of divorce shown above can be due to one or a combination of three changes in marital patterns. First, an increase in the average age of first marriage will increase the average age of the divorces resulting from those marriages. Second, an increasing prevalence of remarriage after divorce will flatten the age curve of divorce because people in second and subsequent marriages tend to be older when those marriages end in divorce than those who are experiencing first-marriage divorce. Both of these phenomena will cause the age curve of divorce to shift even if the relationship between the likelihood of divorce and the duration of marriage stays constant. The third force that can flatten the divorce curve, therefore, is a change in the relationship between the duration of marriage and the likelihood of divorce. Specifically, if the very low rates of divorce traditionally associated with high duration marriages begin to increase, the age curve of divorce will flatten.
Although we do not have the information needed to measure the impacts of each of these three changes, it is likely that the third force is partly responsible for the flattening of the divorce curve shown above, at least for divorces occurring over age 40. This is because the effects of later ages at first marriage on divorce will be concentrated below age 40 and because the U.S. rate of remarriage after divorce has been falling since 1975 (Schoen and Standish, 2001). Increases in the probability of divorce at higher marriage durations, and therefore at higher ages, are probably an extension into older ages of the greater individualism and desire for personal fulfillment that increased the prevalence of divorce among the young decades ago. Whereas older adults may previously have accepted unrewarding marital relationships as part of growing old, or because they viewed the costs of divorce as outweighing any benefits they might expect to enjoy during their remaining years, older people are less likely to hold either of these beliefs today.
The resulting increased prevalence of divorce among older adults is likely to bring changes to U.S. family patterns. For example, grandparents have been an important source of aid for their young adult children, especially those who experience the emotional and financial stresses of divorce (Cherlin, 2010). As divorce among grandparents becomes more common, their ability to provide such aid may decline. Indeed, some grandparents who divorce may need to turn to their offspring for help in dealing with their changed life situations. Thus, the changing shape of the age curve of divorce may be beginning to alter long-standing patterns in the direction of intergenerational transfers within families.
References
Brown, Susan L. and I-Fen Lin. (2012). The grey divorce revolution: Rising divorce among middle aged and older adults, 1990-2010. Journals of Gerontology Series B, 67, 731-741.
Bumpass, Larry L, Teresa C. Martin and James A. Sweet. (1991). The impact of family background and early marital factors on marital disruption. Journal of Family Issues, 12: 22-42.
Cherlin, Andrew J. (2010). Demographic trends in the United States: A review of research in the 2000s. Journal of Marriage and the Family, 72: 403-419.
Clarke, Sally C. (1995). Advance report of final divorce statistics, 1989 and 1990. Monthly Vital Statistics Report, 43(9), 1-31.
Kennedy, Sheela and Steven Ruggles. (2014). Breaking up is hard to count: The rise of divorce in the United States, 1980-2010, Demography, 51, 587-598.
Schoen, Robert and Nicola Standish. (2001). The retrenchment of marriage: Results from marital status live tables for the United States, 1995. Population and Development Review, 27: 553-563.
Foot note
¹ present data for women rather than men because American women are more accurate reporters of their divorce histories than are American men (Bumpass et al., 1991, pp. 24-26). The data for 1970 and 1990 are from Clark (1995, p. 14) while those for 2010 were calculated from the 2009–2011 American Community Survey compilation available from the Integrated Public Use Microdata Series at the Minnesota Population Center’s website. Although the rates presented in the former source have an open ended upper category (65 years and older) I have truncated the graph at age 70-75 because very few divorces occur above that category.
²Fitting the data points for these age categories using least-squares regression yields regression slopes that are the same as those reported above, except that the slope for 1990 equals -1.2 rather than -1.3.
³These sums are represented in Figure 1 by the areas under their respective divorce curves. This measure of the overall propensity to divorce is analogous to the “Total Fertility Rate”, the most widely used measure of the propensity of women to bear children.
4 This is consistent with results reported by Kennedy and Ruggles (2014, p. 593), who used age standardization to show that recent overall levels of divorce are among the hignest ever recorded for the U.S.).