An Almost Ideal Pension System for Europe (and other countries)

Pay-as-you-go (PAYG) pension systems are frequent in OECD countries, usually in combination with some form of funding (OECD 2014, 2015), and they have been very extensively studied. But their reputation is not particularly good: flaws that include budget imbalances, inter- and intra-generational inequities, or distortions of saving and labour market participation are, allegedly, more than just accidental and unfortunate occurrences.
However, a class of PAYG pensions systems, called AIPSs (Almost Ideal Pension Systems – plural, yes: this is a whole family of systems) may constitute a theoretical step forward in this field, and even find practical application in several countries – each in its own way (De Santis, 2015). These systems share a common feature in that they consistently apply the notion that everything is relative.
Relative life shares
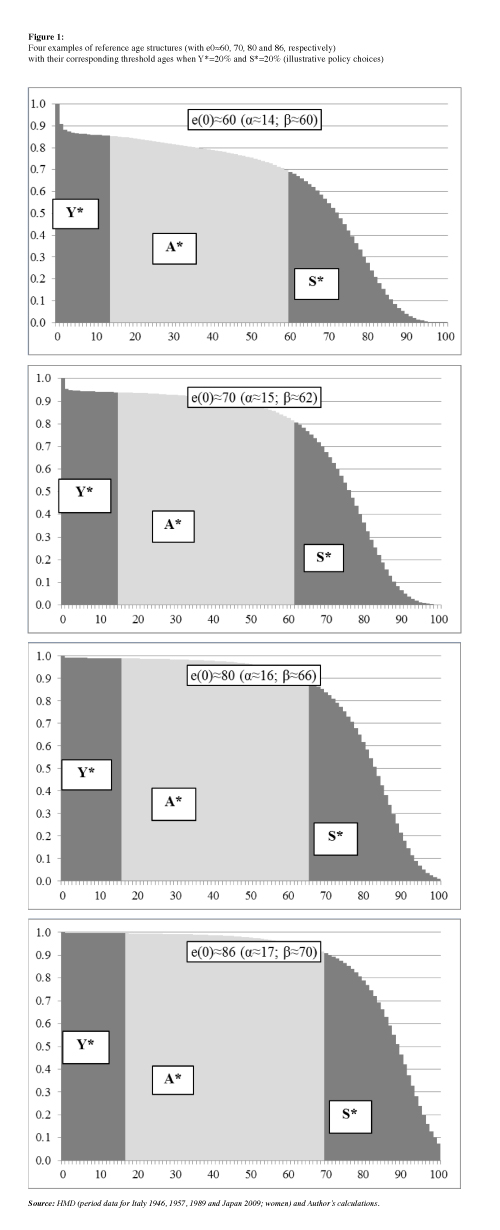
Let us start with one’s “normal” working life: how long should that be? More precisely, the question should be asked in a slightly different way: how long do youth and old age (or seniority, as I will call it here) last? The best answer, in my opinion, is: “a given, nationally preferred but fixed, proportion of one’s ‘normal’ length of life”. The notion of ‘normal length of life’ is, admittedly, debatable: as a first approximation, let us adopt as a standard of reference the current, cross-sectional life table, and let us tentatively start with Y*=20% and S*=20% (two admittedly arbitrary values), which simply means that both youth and seniority are set to a fifth of one’s “normal” life. The corresponding threshold ages a and b (separating, respectively, youth from adulthood and adulthood from seniority) must be first identified, and then adjusted, on the current life table in such a way that the target values (Y*=20% and S*=20%) are always preserved, now and forever in the future. In the illustrative example of Figure 1, for instance, the standard retirement age b progressively moves from about 60 to about 70 years, as e0, or life expectancy, increases from 60 to 86 (which may take about a century in actual populations). In the meantime, a, too, evolves: the age that separates youth from adulthood must pass from about 14 to about 17 for the target value (Y*=20%) to be met.
One may then apply these evolving threshold ages to the actual population (the same whose life table is being used) and get the actual proportions of young people Y, adults A, and seniors S, which, contrary to their “reference” counterpart (with asterisk), change over time, because of the interplay of fertility, mortality and migration. But the change is not totally random: with a proper choice of the standard of reference, it can be shown that the standard (with asterisk, constant) values are the averages around which the actual values of Y, A and S oscillate.
Relative pension benefits
What is the best average value of pension benefits? My answer is “a given, nationally preferred but fixed, proportion of the current net average labour earning of the country”. The latter is a tricky notion: first, it demands that one takes into account both the employment rate e (E/A, employed over adults) and the gross average labour earning of the employed G. A simple multiplication of the two gives Ga, the current gross average labour earning of the adults – where the adults, by the very definition given above, are those who are, let us say, “supposed” to work. The employed pay a pension contribution rate c, so that their net average earning reduces to Wa=(1-c)Ga. This Wa (average net labour earning of the adults) is, in my opinion, the economic standard of reference that should be used for pensions. The average pension benefit P paid to the seniors of that community will (always) be a fixed, collectively decided, proportion p of Wa.
The advantages of tackling the pension issue in this way are numerous. For instance, the contribution rate c can be calculated very simply as c=Sp/(A+Sp) (De Santis, 2015). This contribution rates varies over time, but, once again, around an average value c* [=S*p/(A*+S*p)] which is, instead, fixed, and known in advance. And the budget of the pension system is always balanced, because, by definition, inflows match outflows every year.
In economically good times, employment or wages (or both) will increase, and so will Wa and P=pWa. In demographically good times (demographic bonus), the proportion of adults A in the population will be larger than usual, which will keep the contribution rate c low. Given Ga, this will push both Wa and P upwards. In short: when things go well, everybody is better off; in harsh times everybody is worse off – but in all cases, and in all economic and demographic scenarios, the average relative distance between the two groups (adults and seniors) remains unaffected.
Note, also, that nothing (ever) needs to be forecast: the system uses only current values, and automatically adapts to all possible demographic and economic circumstances.
Individual pension benefits, between actuarial equity and redistribution
So much for the averages. But what about individual pension benefits? Should they all be equal or should they reflect past contributions to the pension system? The answer, as before, depends on national preferences. At one extreme, one may want all individual pension benefits Pi to be the same, at the average level, so that Pi=P. At the other extreme, one my want them to match the (present value of the) sum of all past contributions to the pension system Ki (which, just like everything else in this world, count in relative terms: relative to the average of such contributions K), so that Pi=PKi/K. Or one may want a bit of both, giving weight Q to the actuarially equitable part, and weight (1-Q) to the redistributive part – where, needless to say, Q is the nationally preferred value. Whatever the choice of Q, all the other characteristics of the system (budget balance, constant relative economic well-being of all groups, etc.) remain unaffected.
Summing up …
The proposed AIPS, or Almost Ideal Pension System, has, among its merits, a predefined number of degrees of freedom (or explicit policy choices, if you prefer): Y*, S*, p, Q, which are all parameters ranging between 0 and 1. In practice this means that every country can adopt AIPS in its preferred version, with generous or not-so-generous pension benefits, early or late retirement, redistribution towards the poor or, conversely, actuarial equity … The 28 countries of Europe, for instance, could agree with relative ease to a common pension standard (of the AIPS type), to be applied locally according to the specific policy choices that best fit each country, thus obtaining the “diversity in unity” that the 2000 EU motto invokes, but that has thus far only seldom found practical application.
References
De Santis, G. 2015. More with less: the almost ideal pension systems (AIPSs), in Vienna Demographic Yearbook 2014 (12): 169-192. doi:10.1553/populationyearbook2014s169
OECD 2014. OECD Pensions Outlook 2014, OECD Publishing,
OECD. (2015), Pensions at a Glance 2015: OECD and G20 indicators, OECD Publishing, Paris.