The transition to late adulthood: past adversities increase frailty
Health deteriorates with age, and it can be further worsened by adversities experienced during early adulthood and middle age. On SHARE data, Francesca Zanasi, Gustavo De Santis and Elena Pirani measure how disadvantages in several life domains affect frailty at later ages (60-79 years), accounting for the persistence over time of these disadvantages and their coexistence (periods when they were experienced simultaneously).
Health declines in old age, but this process is accelerated if adulthood is affected by one or more adverse events, in terms of unemployment, financial hardship, stress, or bad health.How relevant are these episodes and what is the role played by persistence and coexistence of disadvantages? The former refers to the duration of periods when individuals are “under pressure”, not necessarily because of the same types of problems. The latter focuses on periods of “multiple disadvantages” (simultaneous occurrence of adverse events) and, again, on their duration.
Data, variables, and method
In a recent paper, we measured these effects on data taken from SHARE, the Survey of Health, Ageing, and Retirement in Europe (2004‒2017) (Zanasi, De Santis and Pirani, 2021). Our dependent variable is frailty in late adulthood, at ages 60‒64, 65‒69, 70‒74, and 75‒79. Frailty is measured with a 40-item index validated on the SHARE dataset measuring the number of health, or health-related, deficits reported by respondents. The index is normalized, so as to range between 0 (perfect conditions) and 1 (presence of all the 40 possible deficits). In practice, however, the observed maximum of the index is much lower (less than 0.5), and its average is relatively low, between 0.11 and 0.16 (Table 1).
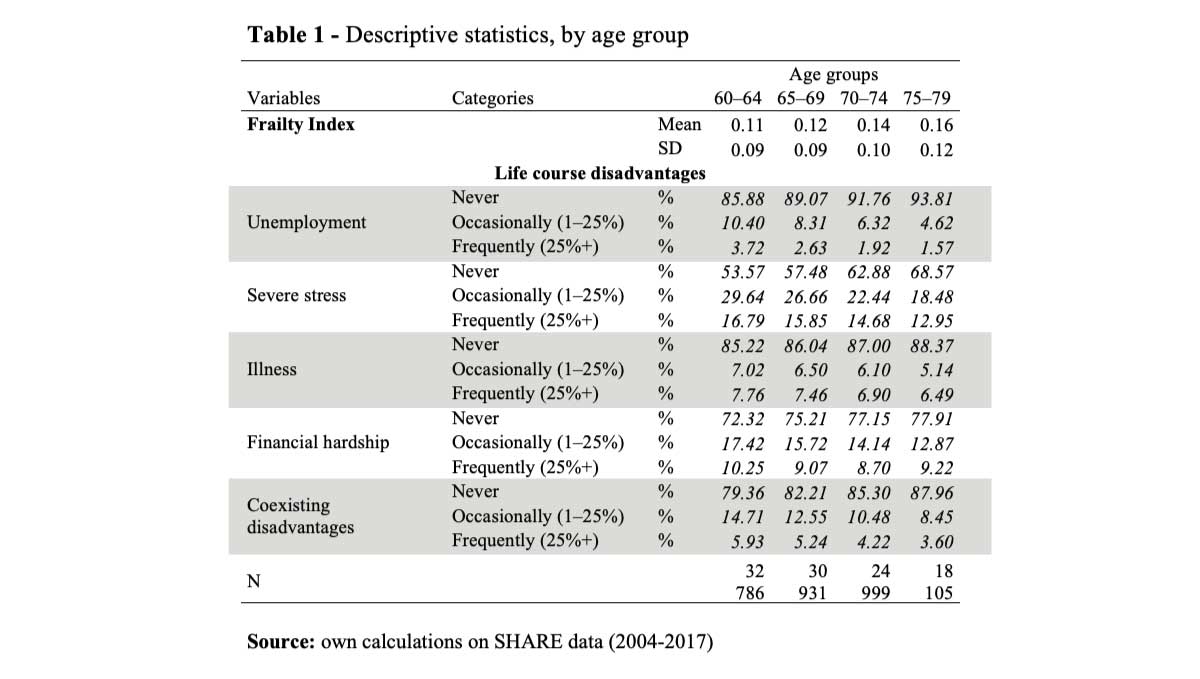
Our main independent variables refer to the disadvantages suffered in working-age adulthood (ages 25 to 59 years) in four domains (unemployment, financial hardship, severe stress, and bad health). For each disadvantage, we computed a variable describing its persistence in working-age adulthood, i.e. the share of life (between ages 25 and 59 years) spent with a certain disadvantage: never, occasionally, or frequently, where occasionally means between 1% and 24%, and frequently mean 25% or more. Beyond that, we also measured the frequency of coexisting disadvantages, that is, the share of working-age adult life that an individual spent with two or more disadvantages simultaneously. We classified these occurrences as before: never, occasionally, or frequently.
We used a set of linear regressions, which we ran both with and without covariates, to better grasp the role played by the persistence and coexistence of disadvantages. Here, however, we will refer exclusively to the simple case, without covariates.
The legacy of the past
Figure 1 shows the predicted evolution of frailty by age under the assumption that no other disadvantage was experienced in adulthood (linear regression, no covariates). Frailty increases with age: this holds also for individuals who never experienced any disadvantage in adulthood, but levels and slope reflect past adverse events. The worst case emerges in relation to past health conditions (illness). For instance, those whose health was frequently poor at working ages (more than 25% of the time) have a frailty index (0.17) at ages 60‒64 years, which is higher than that of consistently healthy people at much older ages, between 75 and 79 years (0.15).
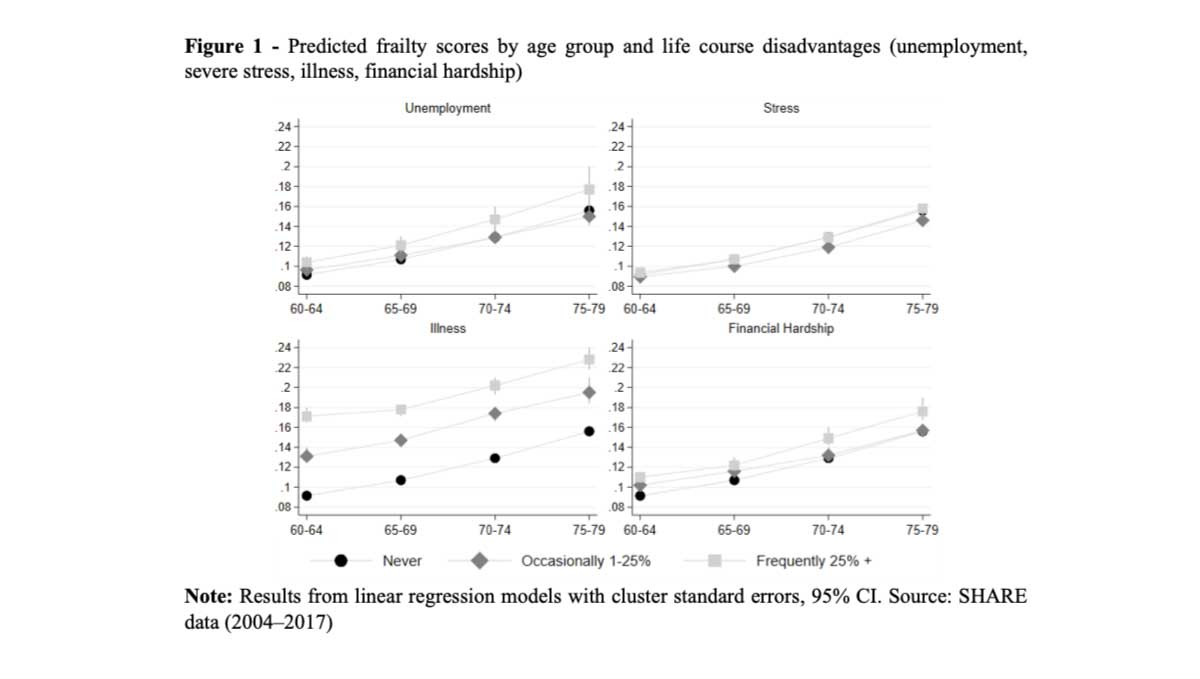
Let us look at things from a slightly different perspective. Instead of measuring frailty in “percentage points”, let us transform it into “years of life lost”. On average, frailty increases by 5 points over 15 years, from ages 60-64 to ages 75-79 (first line of Figure 1), i.e. by approximately 1/3 of a point every year. Therefore, a frailty difference of merely one percentage point corresponds to some three years of life; five percentage points correspond to 15 years of life, etc. People who had difficult experiences in working-age adulthood may well have the same chronological age as the reference group (no disadvantage, ever) but, physiologically, they turn out to be 3, …, 15, … ny ears older.
More disadvantages, worse outcomes
Turning to coexisting disadvantages, the upper panels of Figure 2 show the most common disadvantage profiles for individuals who experienced simultaneous disadvantages (financial hardship and stress) only occasionally (1–25% of their working-age adult lives). The bottom panels, instead, show the most common profiles for those who experienced coexisting disadvantages frequently, that is more than 25% of their working-age adult life: stress and financial hardship (bottom left), illness and stress (bottom right). The latter situation appears to be particularly harmful. For example, while the “independent” experience of frequent stress is associated to a frailty score of roughly 0.16 (Figure 1) by the age of 75-79 years, the combination with financial hardship raises it to 0.20 (bottom left panel of Figure 2). The worst case concerns individuals who were both sick and under severe stress at the same time (frequently, during their working-age adult years): their frailty index starts very high (0.20 at age 60-64) and reaches 0.25 by ages 75-79.

Conclusions
Frailty inequalities may be profound and, although this is frequently overlooked, they depend on the individual life course, which means that poor conditions tend to persist up to late in life. All the disadvantages suffered in the past, in all life domains (at least those that we could consider here) matter, but it is their cumulative effects that turns out to be particularly harmful. This calls for early action against disadvantages, if the goal of “active ageing” is to be pursued.
Funding
This work was supported by the Italian MIUR through the JPI MYBL / CREW Project (Joint Programme Initiative: More Years Better Life, 2016 Call. CREW: Care, retirement and wellbeing of older people across different welfare regimes. MIUR Decree: n. 3266/2018; Official Bulletin no. 32, 7 Feb 2019).
References
Ben-Shlomo, Y., & Kuh, D. (2002). A life course approach to chronic disease epidemiology: Conceptual models, empirical challenges and interdisciplinary perspectives. International Journal of Epidemiology, 31(2), 285–293.
Corna, L. M. (2013). A life course perspective on socioeconomic inequalities in health: A critical review of conceptual frameworks. Advances in Life Course Research, 18(2), 150–159.
Heap, J., Lennartsson, C., & Thorslund, M. (2013). Coexisting disadvantages across the adult age span: A comparison of older and younger age groups in the Swedish welfare state. International Journal of Social Welfare,22(2), 130–140.
Kuh, D., Ben-Shlomo, Y., Lynch, J., Hallqvist, J., & Power, C. (2003). Life Course Epidemiology. Journal of Epidemiology and Community Health, 57(10), 778–783.
Lu, W., Benson, R., Glaser, K., Platts, L. G., Corna, L. M., Worts, D., … Sacker, A. (2017). Relationship between employment histories and frailty trajectories in later life: Evidence from the English Longitudinal study of ageing. Journal of Epidemiology and Community Health, 71(5), 439–445.
Romero-Ortuno, R., & Kenny, R. A. (2012). The frailty index in Europeans: association with age and mortality. Age and Ageing, 41, 684–689.
Stolz, E., Mayerl, H., Waxenegger, A., Rásky, E., & Freidl, W. (2016). Impact of socioeconomic position on frailty trajectories in 10 European countries: Evidence from the Survey of Health, Ageing and Retirement in Europe (2004-2013). Journal of Epidemiology and Community Health, 71(1), 73–80.
SHARE – Survey of Health, Ageing and Retirement in Europe
Zanasi, F., De Santis, G., Pirani E. (2021) Frailty in late years: the legacy of coexistence and persistence of disadvantages in working-age adulthood, DiSIA Working Paper 2021/09, https://local.disia.unifi.it/wp_disia/2021/wp_disia_2021_09.pdf.