

Childhood has gained renewed attention from academics, researchers and policy makers, as evidence shows that this stage of life deeply affects future educational achievements and labour market success (Blanden, Gregg and Macmillan 2007). Children born in poor families are more likely to suffer from worse health, and lower educational and behavioural outcomes (Khanam, Nghiem and Connelly 2014; Khanam and Nghiem 2016). This, in turn, may cause an inter-generational transmission of poverty, because lower educational and behavioural outcomes in childhood usually lead to lower labour earnings later in life. Therefore, investment in childhood is crucial and, incidentally, more effective than investment in other stages of life (Heckman, Stixrud and Urzua 2006).
For a long time there has been a consensus that there is a connection between family income and child educational and behavioural development. Using data from the first five waves of the nationally representative Longitudinal Study of Australian children (LSAC), we looked at the pathways of this connection to get more insight on the story behind this apparently well-established link. The LSAC sample consists of all children born between March 2003 and February 2004 (B-Cohort, infants aged 0-1 years in 2004), and between March 1999 and February 2000 (K-Cohort, children aged 4-5 years in 2004). The LSAC consists of 10,000 children, approximately 5,000 from each cohort. It involves biennial follow-up of the enrolled households and will continue until at least 2018
Our measures of educational and behavioural outcome
We use Matrix Reasoning test (MR)¹, Peabody Picture Vocabulary Test (PPVT)² and Literacy and Mathematical skills³ to measure children’s educational outcomes. To measure their behavioural development, we use five measures of the Strengths and Difficulties Questionnaire (SDQ): 1) Pro-social scale, (2) Hyperactivity scale, (3) Emotional problems scale, (4) Conduct problems scale and (5) Peer problems. The SDQ pro-social scale is the sum of responses to five 3-point questions (1=not true, 2=somewhat true, 3=certainly true): “considerate of other’s feelings”, “readily shares with children”, “helpful if someone is hurt”, “kind to younger children” and “often volunteers to help”. A high score on the SDQ pro-social scale indicates a positive attitude. Similarly, the SDQ hyper activity scale is the sum of responses to five 3-point questions: not able to stay still, constantly fidgeting, easily distracted, stops to think before acting, and has a good attention span. A high score on the SDQ hyperactivity scale indicates that the child is hyperactive. The SDQ emotional problem scale is the sum of responses to 5 questions: “complains of headache”, “often seems worried”, “often unhappy or tearful”, “nervous or easily loses confidence” and “has many fears”. A high score on the SDQ emotional problem scale indicates an emotional problem. In contrast, the SDQ conduct problem scale is calculated as the mean of responses to five 3-point Likert scale questions on whether the child: “has hot temper”, “not obedient, often fights”, “argumentative with adults” and “spiteful to others”. Similarly, the SDQ peer problem scale is calculated as the rescaled mean of responses to five 3-point Likert scale questions: the child “has been solitary”, “has no good friend”, “not liked by other children”, “bullied by children”, and “gets on better with adults”. A high score indicates a negative symptom, except for the SDQ pro-social scale, for which a high score indicates a positive outcome.

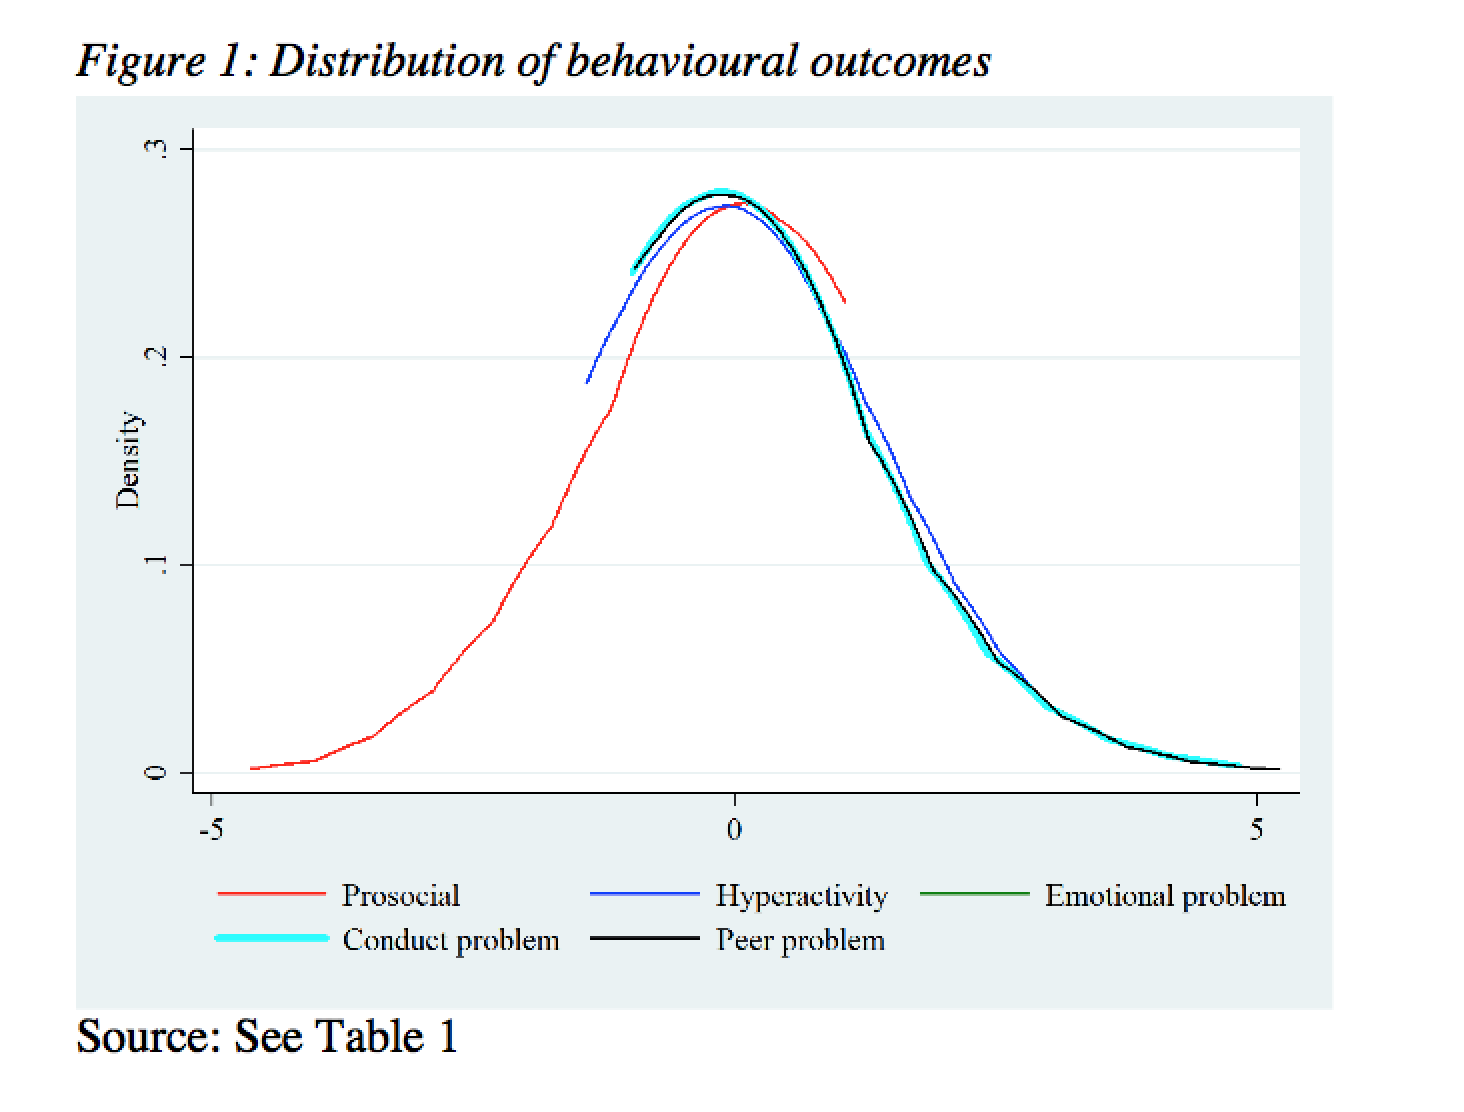
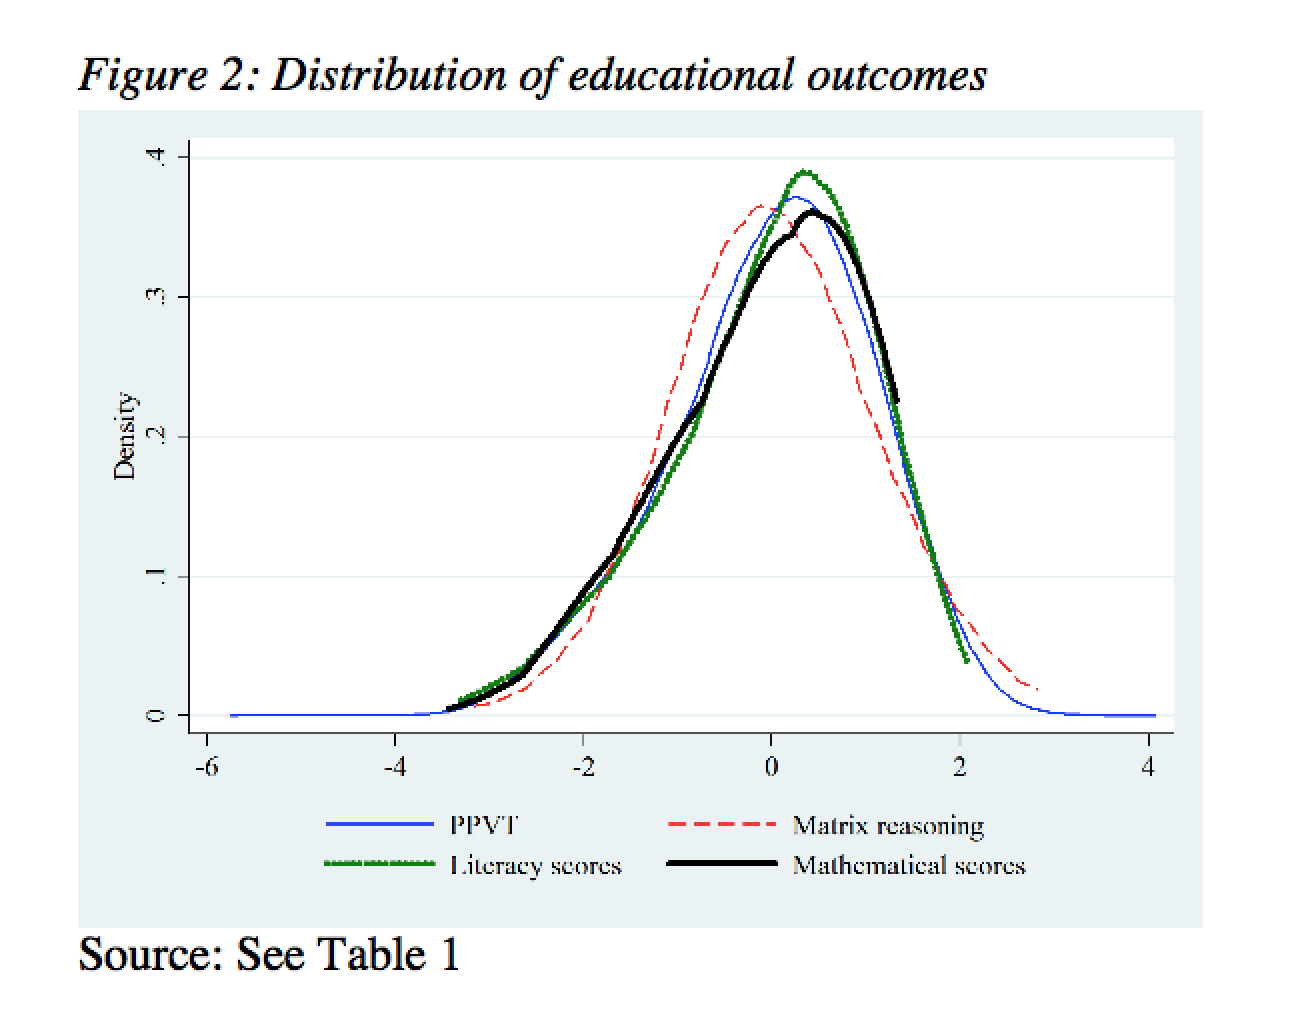
We standardised all the indicators of educational and behavioural outcomes. Table 1 and Figures 1 and 2 show the distribution of these outcomes using data for the K-cohort only, as K-cohort has data for all the outcomes. It can be seen that with normalisation all outcomes have a mean of zero and standard deviation of one.
In our analysis we regress these nine standardised outcome variables separately on a set of independent variables: previous educational and behavioural outcome, log of family income, gender, age, birthweight and physical health of the child, whether the child was first born, Aboriginal and Torres Strait Islanders status, household size, whether both biological parents at home, whether English spoken at home, education, working hours, age, physical & mental health of parents, housing tenure, out of home activities with child, numbers of children’s books in home, father’s & mother’s parenting style and neighbourhood characteristics.
Family income and child outcomes
To investigate the effects of income on the child’s outcomes net of other variables, we tried several models. In the simplest version, family income indeed seems to plays an important role both for the child’s educational outcome and for its social behaviour. However, while the connection between income and educational performance persists even in more complex models, the connection between income and behavioural outcomes disappears when parental stress4 and parenting styles5 are introduced in the model.
Determinants of child’s educational and behavioural outcomes
What we found is that family stress – that is parenting styles and parental mental health, especially mother’s mental health – are extremely important for child emotional and behavioural development. Mothers who have a ‘warm parenting style’, invest in their children, give them access to books, computers and outdoors activities may compensate for the income-potential gap. Neighbourhood characteristics can also have an impact. For example, children living in a better neighbourhood are more likely to be self-confident, less likely to be hyperactive, and less likely to have emotional problems.
Our study further confirmed that parents’ education is important both for educational and behavioural outcomes. Healthy children are more likely to be pro-social and behave well. Low birthweights negatively affects the child’s literacy, mathematics, PPVT and reasoning.
Children living with both parents are less likely to be hyperactive, and when their parents are in good (physical and mental) health, children less likely to behave badly and are more likely to be pro-social.
Dynamic nature of children’s human capital development
Thanks to the longitudinal nature of our data set we were able to include children’s previous educational and behavioural outcomes in the modelling of child development to examine the dynamics of these phenomena, which is rarely possible in this type of study. We found that children’s previous educational and behavioural outcomes are significant determinants of current outcomes. This finding may not be a great surprise, but it stresses the importance of early intervention and investments in child development.
References
Blanden J., Gregg P., Macmillan L. (2007) Accounting for intergenerational income persistence: noncognitive skills, ability and education, The Economic Journal, Volume 117 (519): C43–C60.
Heckman J.J., Stixrud J., Urzua S. (2006) The effects of cognitive and noncognitive abilities on labor market outcomes and social behavior, NBER Working Paper No. 12006.
Khanam R., Nghiem H.S. (2016) Family income and child cognitive and noncognitive development in Australia: does money matter?, Demography, 53(3): 597–621.
Khanam R., Nghiem H.S, Connelly L.B. (2013) What roles do contemporaneous and cumulative incomes play in the income – child health gradient for young children? Evidence from an Australian panel. Health Economics, 23(8): 879-93.
¹ Children from wave 2 to 5 completed the MR test from the Wechsler Intelligence Scale for Children, 4th edition (WISC-IV). MR tests assess a child’s non-verbal intelligence by presenting them with an incomplete set of pictures, which they need to complete by selecting a picture from 5 different options. The raw matrix reasoning score is presented as the number of correct answers. This indicator has been used widely to measure child development.
² The PPVT is an interviewer-administered test that assesses a child’s listening comprehension ability for spoken words in standard English. The PPVT test requires a child to show the picture that best represents the meaning of a stimuli word spoken by the examiner.
³ Questions on literacy and Mathematical skills were answered by both parents and teachers. We selected the results given by teachers, assuming they had more detailed knowledge of the child’s academic performance. This variable consisted of the average of answers to 5-point Likert scale questions, such as the child’s contribution to classroom discussions, understanding and interpreting stories, and reading and writing comprehension. Similarly, mathematical skills captured the average of a series of 5-point Likert scale questions on issues such as understanding of places and values, organising data in graph, estimation of quantities, and use of various strategies to solve mathematical problems.
4 Parents’ physical & mental health are used to measure parental stress.
5 Parenting style is measured by parental warmth scale, which is mean of 5-point Likert scale questions (1=never, 5=always) about the frequency of showing affection (e.g., hug) to children and expressing happiness to children. The questions asked were: how often do you (1) express affection by hugging, kissing and holding this child? (2) hug or hold this child for no particular reason? (3) tell this child how happy he/she makes you? (4) have warm, close times together with this child? (5) enjoy doing things with this child? (6) feel close to this child both when he/she is happy and when he/she is upset?