

In the prominent political debates about population decline and ageing, short-term changes in the period total fertility rate (TFR) are the main point of reference, even though they can be heavily distorted by changes in the timing of births. Good alternatives exist, say Wolfgang Lutz, Tomáš Sobotka and Kryštof Zeman, but they are rarely used.
At the Budapest Demographic Summit in September 2023, Hungary’s President and former Family Minister Katalin Novák told a prominent international audience that Hungary had found a pro-family answer to the demographic crisis: family-related spending amounting to 6% of GDP – presumably the highest level globally – had resulted in a significant fertility increase. Subsequently, Italian Prime Minister Georgia Meloni proclaimed that Italy will now copy these “highly successful” Hungarian policies to increase Italian fertility. International media reported these statements without questioning the underlying demographic evidence.
Ups and downs in period TFR are often driven by changes in birth timing
What were the actual fertility trends that elicited these strong statements? Hungarian policy makers pointed at the TFR increasing from a record low of 1.25 in 2010 (when Viktor Orbán returned to power as prime minister) to 1.59 in 2021 (Figure 1). This is indeed a rather impressive increase of 27% – or a third of a child – over a decade. But what do these numbers tell us?
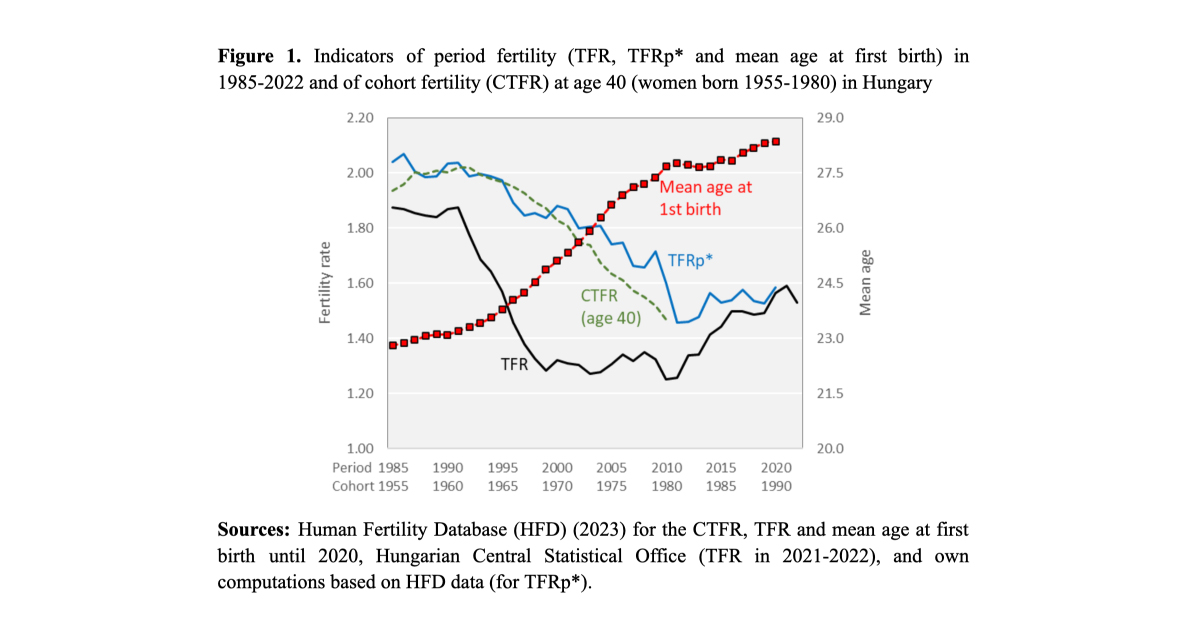
In Hungary, 2010 was a very specific year due to a spiraling debt crisis. Such economic shocks often accelerate the shift to later parenthood, whereas economic recovery and new family policies frequently contribute to a slowdown in this shift or even a temporary stabilization in fertility timing (e.g., Sobotka, Matysiak and Brzozowska 2019). This is exactly what happened in Hungary. In the decade 2000-2010, the mean age at first birth among Hungarian women jumped from 25.1 to 27.7, rising by almost 2.6 years and strongly deflating the TFR. In the next decade, the mean age at first birth almost levelled off, going up by just 0.7 years to 28.4 in 2020. The observed increases in the TFR were primarily driven by these changing patterns in the timing of births, i.e. a slowdown in the previously strong postponement of childbearing.
The TFR does not measure the quantum of fertility
How should we assess fertility levels and trends in times of policy changes, economic shocks, and rapid societal shifts? Today most analytical studies and policy-making discussions choose to focus exclusively on the TFR. From a theoretical perspective this seems odd because the TFR is neither an appropriate measure of the direct impacts on population size and age structure nor an appropriate measure of the quantum of fertility. But convenience typically trumps theoretical considerations: TFRs are readily available for almost all countries and regions and often also for specific population groups. And they offer a seemingly straightforward interpretation as the “number of children per woman”.
Two aspects should be of main interest to policy makers and scientists studying longer-term implications of fertility:
1. The absolute number of births per year is the only variable that directly translates the effect of current fertility on changes in population size and age structures. Together with mortality and migration, it determines the size of cohorts for many decades into the future and should therefore be the key element of any demography-based planning. Due to shifting age structure and continuing outmigration of younger people, the number of women of reproductive age declined in Hungary between 2010 and 2020. Therefore, despite a robust rise in the TFR, the number of live births stagnated in that period, with a total of just 90,000 in 2010 and 92,000 in 2020. This is well below the level required to keep the population size stable in the absence of migration and changes in mortality. A crude estimate of the number of births needed to “replace” expected deaths, computed by dividing total population in 2020 (9.7 million) by its life expectancy (76 years), gives a figure of 127,000 births in Hungary each year, almost 40% above the actual number.
2. The quantum of fertility refers to the number of live births a woman has on average over her life course. This can only be assessed directly for cohorts of women who have completed their childbearing. For women aged 40 this indicator was steadily declining in Hungary among those born in the 1960s and 1970s, so far with no sign of a turnaround (Figure 1). But computing completed cohort fertility rate (CTFR) implies too long a waiting time for the impatient observer who wants to know how younger women react to changing conditions and stimuli, including family policies. For this reason, many analysts turn to the TFR. But this is a poor proxy for the period fertility quantum and a poor reference indicator in policy discussions because it only eliminates distortions due to age structure but not changes in timing, which played an important role in Hungary.
There are suitable alternatives to the TFR to measure the period fertility quantum
Over the past 25 years, different methods for calculating estimates of the period fertility quantum have been proposed. A method based on adjusting conventional TFRs for the pace of change in birth timing was proposed by Bongaarts and Feeney in 1998. It is easy to calculate for countries with order-specific data on fertility rates and remains commonly used to date (it is also available in the Human Fertility Database). However, it sometimes shows large fluctuations and may provide implausible results when the variance of fertility by age or the parity composition change rapidly. The indicator of tempo- and parity-adjusted total fertility rate, TFRp* (originally proposed by Bongaarts and Feeney in 2006 and elaborated by Bongaarts and Sobotka in 2012), is less widely used, but provides more robust measures of the true quantum of period fertility. For most European countries, the TFRp* is available in the European Demographic Datasheet (VID 2022) and can be calculated from HFD data.
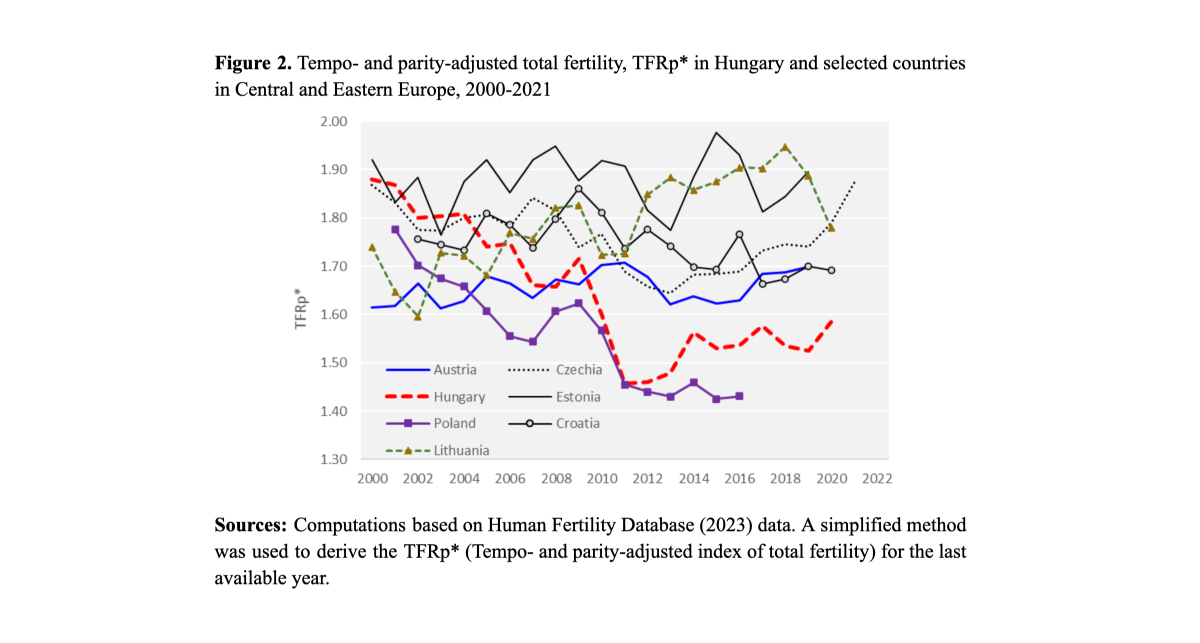
Hovering around 1.5-1.6, the TFRp* in Hungary did not change much between 2010 and 2020 (Figure 1 above). When we compare TFRp* trends in Hungary and selected other countries in Central and Eastern Europe (Figure 2), three main findings emerge. First, the TFRp* is, as expected, higher and more stable than the conventional TFR. Second, the upswing in the TFR that was apparent for many countries in the 2010s, is largely absent in the TFRp*. Most of the TFR rise in the 2010s can therefore be attributed to the slowing pace of fertility postponement. Third, five out of seven countries featured in the graph show TFRp* levels in 2016-2021 (when the latest data were available) similar to those of 2000. Only Poland and Hungary display considerably lower TFRp* levels, suggesting that their earlier fertility declines did not subsequently recover.
We need to move beyond the TFR
Since politicians and journalists cannot be expected to know the difference between fertility indicators, the responsibility falls on the demographers who provide them with the indicators, and whose interpretations all too often uncritically refer to trends in the TFR as trends in the quantum of fertility. Our examples for Hungary illustrate that the TFR can easily send wrong signals about fertility trends and their underlying drivers: the seemingly impressive upturns in the TFR have been largely fueled by a slowdown in the shift to later parenthood and have not been mirrored in corresponding upturns in cohort fertility or in tempo-adjusted period fertility indicators. Demographers should make better use of their toolkit and offer a more differentiated assessment of fertility trends and policy effects, using a broader range of indicators and controlling for the role of tempo effects (Sobotka and Lutz 2011).
References
Bongaarts, J. and Feeney, G., 1998. On the quantum and tempo of fertility. Population and Development Review, 24(2): 271-291. DOI: https://doi.org/10.2307/2807974
Bongaarts, J., and Feeney, G. 2006. The quantum and tempo of life-cycle events. Vienna Yearbook of Population Research, 4(2006): 115–151.
Bongaarts, J. and Sobotka, T., 2012. A demographic explanation for the recent rise in European fertility. Population and Development Review, 38(1): 83-120. DOI: https://doi.org/10.1111/j.1728-4457.2012.00473.x
Human Fertility Database. 2023. Max Planck Institute for Demographic Research (Germany) and Vienna Institute of Demography (OeAW) (Austria). Available at www.humanfertility.org (data downloaded 18 December 2023).
Sobotka, T. and Lutz, W., 2010. Misleading policy messages derived from the period TFR: Should we stop using it? Comparative Population Studies, 35(3). DOI: https://doi.org/10.12765/CPoS-2010-15
Sobotka, T., Matysiak A., and Brzozowska, Z. 2019. Policy responses to low fertility: how effective are they? UNFPA, 2019. VID. 2022. European Demographic Datasheet 2022. Wittgenstein Centre (IIASA, VID/OEAW, University of Vienna), Vienna. Available at www.populationeurope.org