

Spatial inequalities in mortality decreased in France between 1881 and 1980 (“the century of convergence”), and life expectancy increased at national level. However, Florian Bonnet and Hippolyte d’Albis show that the reduction in spatial inequalities
conceals changes in the geography of mortality. For example, the north-eastern départements, industrialized and advanced during the 19th century, now exhibit higher mortality than the rest of France.
Most research on spatial inequalities in mortality concerns recent periods, mainly due to a lack of comparable data. It generally suggests that inequality (measured with some index of dispersion, or concentration) has tended to increase in the last few years. In a recent study, however (Bonnet and d’Albis 2020), we break with this tradition. Combining Bonneuil’s (1997) database with a new one, reconstituting annual life tables by French département and gender for 1901-2014 (Bonnet 2018), we analyse the development of life expectancy inequalities since 1806.
A century of convergence (1881-1980)
Spatial inequalities in life expectancy have fallen sharply since 1806. The Gini index of life expectancy at birth by département fell from 0.105 in that year to 0.005 in 2014. Nevertheless, it would be simplistic to analyse variations in inequalities in life expectancy without also taking into account the evolution of mean life expectancy. For that reason, we calculated variations in the Gini index and in life expectancy in France for each five-year period from 1806 to 2014. The result is plotted in Figure 1, where each point is indicated with the year at the beginning of the period: point 1806, for example, represents the variations between 1806-1810 and 1811-1815.

We identify three phases in the reduction of spatial inequalities in life expectancy. During the first phase, 1806-1880, there are no signs of convergence. The points from this phase are scattered across the four quadrants, which means that life expectancy and inequality went up and down with no clear trend.
The second phase, 1881-1980, may instead be labelled “the century of convergence”: with the exception of two World Wars, life expectancy increased and inequality decreased. It is worth remarking that this reduction in inequality began nearly 50 years before the introduction of the French public insurance systems for illness, old age and death. However, by about 1980 this convergence came to an end. Since then, life expectancy has continued to rise, but inequalities have stopped shrinking; they even widened between 1996 and 2005.
In our study, we also show that spatial inequalities decreased for all age groups, but especially at lower ages, so that the age profile of spatial inequalities changed from a U-shaped to a rising curve. At present, spatial inequalities are three times greater for life expectancy at age 70 than at birth.
Two main conclusions may be drawn from this. First, the reduction in infant mortality played a key role in the decrease in spatial inequalities. Second, spatial inequalities today are mainly due to differences in mortality among the oldest groups. For a given population, the epidemiological transition causes greater variance at higher ages and lesser variance at lower ages (Robine 2001). This study shows that it also affects spatial inequalities.
The changing geography of longevity in France since 1806
Finally, we analyse variations in distribution by département to identify particular patterns in certain areas. Figure 2 shows maps of the French départements for four sub-periods. Blue départements are in the “top” group, where life expectancy is highest. Orange départements are in the “medium” group and brown départements in the “bottom” group – relative to each period, of course.
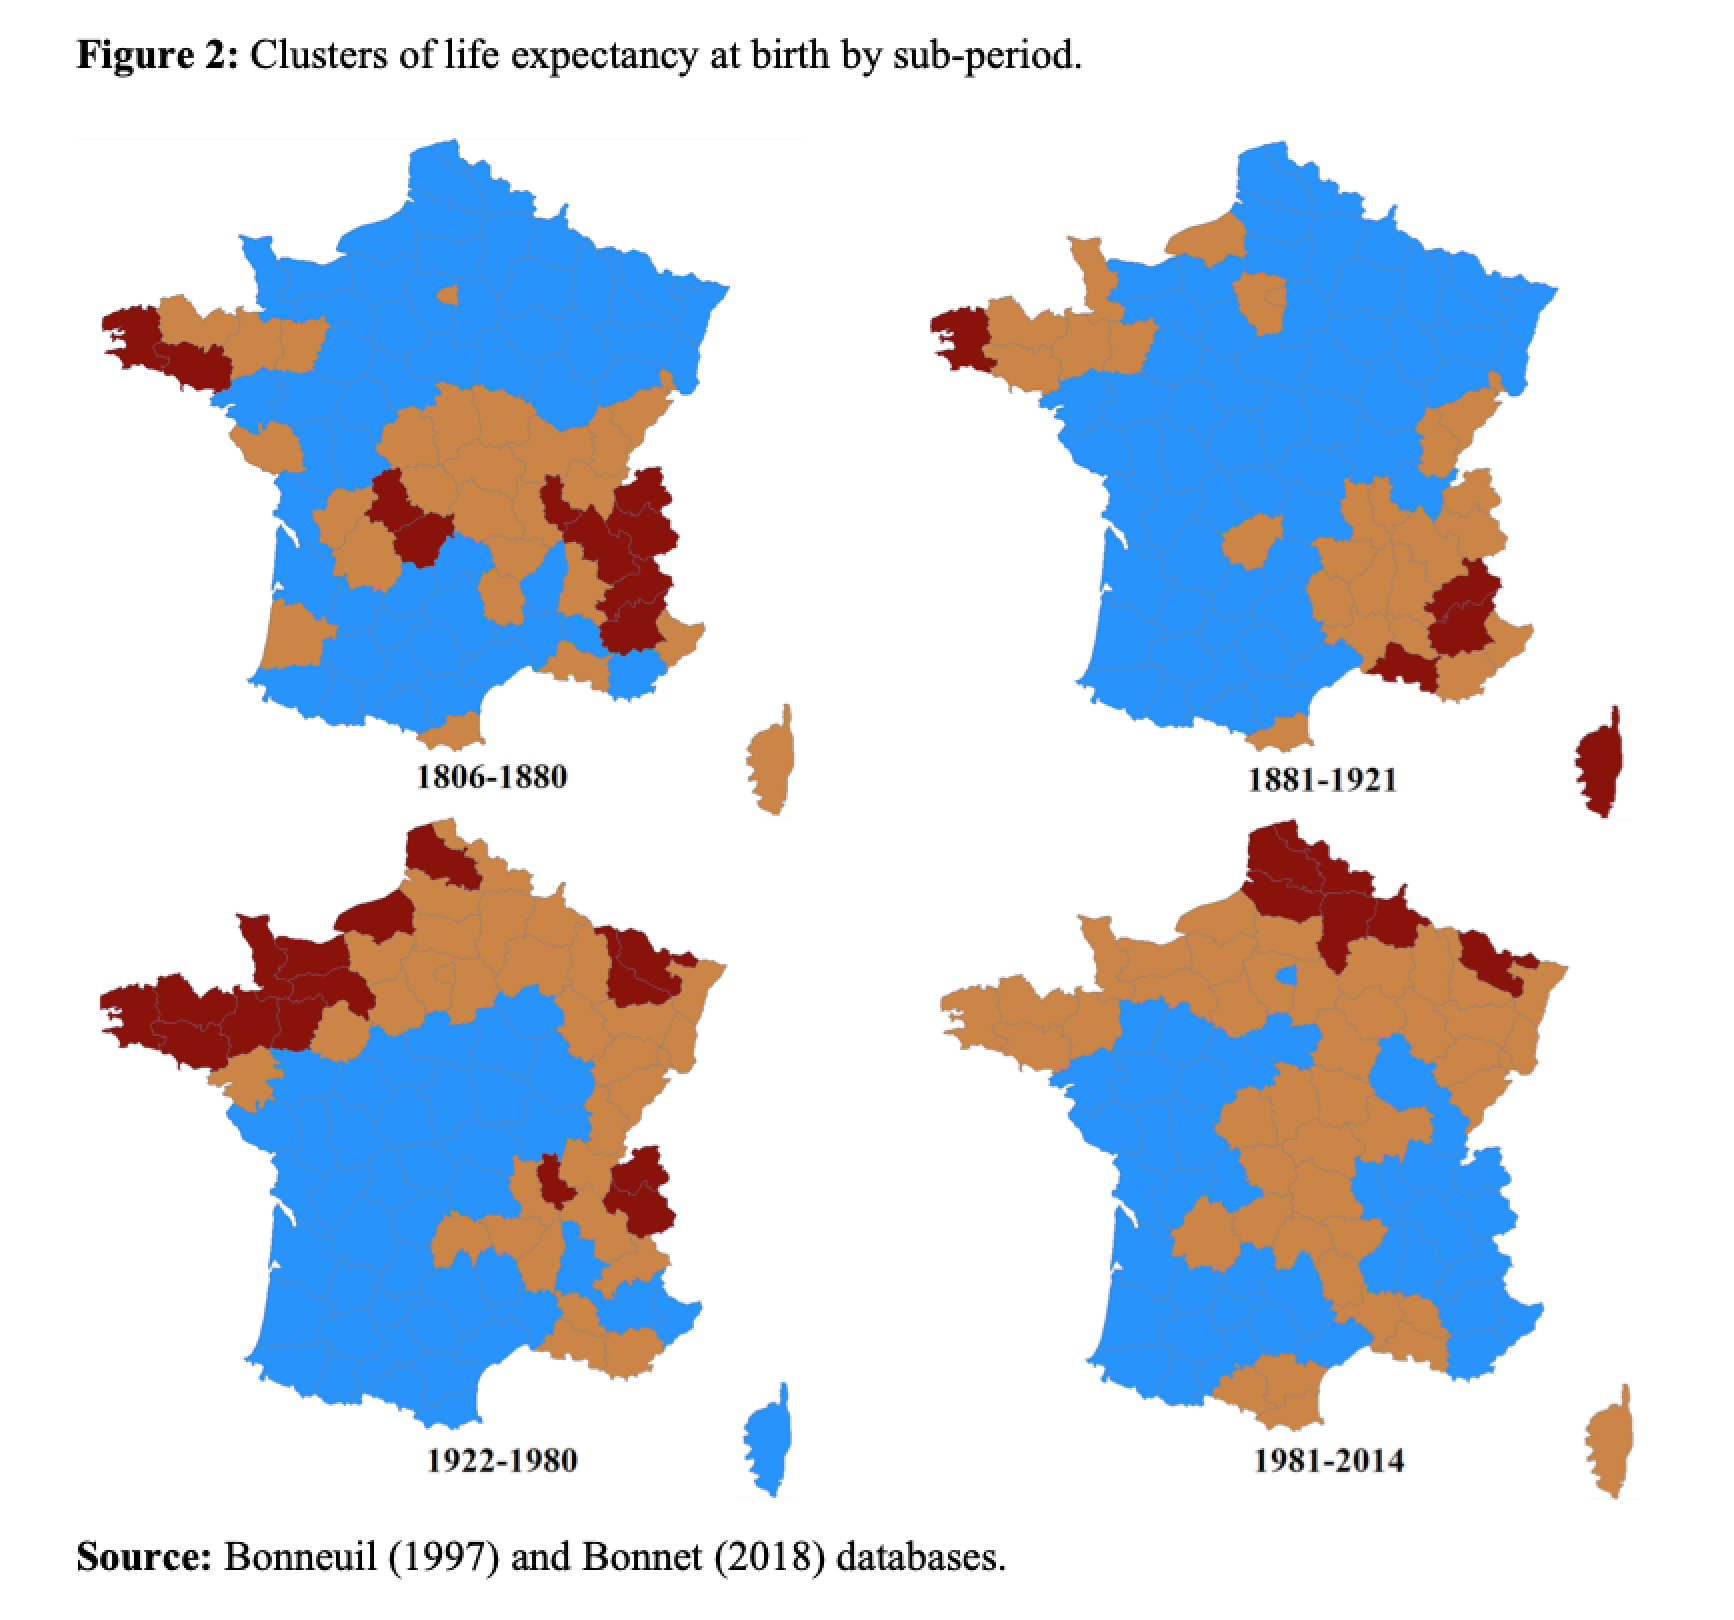
The 1806-1880 period sees France cut in two by a “high mortality diagonal” from Brittany in the west to the Alps in the south-east. Above and below are the départements in the top group. This corresponds to the whole of north-eastern France, except for the Seine département (including Paris)¹and the whole of south-western France. High mortality is concentrated at the ends of the diagonal, in Brittany and the Alps. The 1881-1920 period shows no great difference from the previous one, except that central France joins the top group. High mortality is still at the two ends of the diagonal.
Major changes occur in 1921-1980. The whole of northern France, previously in the top group, is now characterised by high mortality, while the top group now covers a wide area from central to south-western France. The final period, 1981-2014, shows France once again cut in two, this time by a line from north-east to south, similar to the diagonale du vide (“empty diagonal”) of low population density areas (Gravier 1947). The geography of French longevity has totally changed with respect to the 19th century. The north of France, especially along the Belgian border, is now a high-mortality area, including départements like Nord, Ardennes and Moselle that once had the highest life expectancy. The only exception in the northern half of France is the Seine département (Paris), which has moved from the middle to the top group.
The rural-urban mortality divide
The main changes over the last two centuries have affected the urban départements containing the major cities. The emblematic urban département is Seine, comprising Paris and its immediate suburbs. Figure 3 shows its life expectancy relative to the national mean from 1806 on. From 1856, when age-specific mortality data become more reliable, we break this difference down by age-groups (0-5, 5-20, 20-40, 40-65 and 65+). In the 19th century, life expectancy in Paris was well below the national mean (12 percent below in 1816). Haines (2001) calls this the “urban penalty”, which he explains mainly by the spread of infectious disease, made easier by the 2.5-fold increase in population density from 1851 to 1901. Pioneering research by Preston and Van de Walle (1978) shows that the urban penalty – e.g. in départements like Seine (Paris), Rhône (Lyon) and Bouches-du-Rhône (Marseille) – was due to the poor quality of drinking water. Relative life expectancy improved throughout the 20th century in the Seine département, which gradually caught up with national mortality rates and, from the 1940s, began to enjoy an “urban advantage”. This advantage has increased steadily since the 1990s and by 2014 it was about 10 months (0.84 percent) with respect to the national average.

Referencces
Bonnet, Florian. 2018. “Computations of French Lifetables by Département, 1901-2014.” PSE Working Papers (2018-57).
Bonnet, Florian, and Hippolyte d’Albis. 2020. “Spatial Inequality in Mortality in France over the Past Two Centuries.” Population and Development Review
Bonneuil, Noël. 1997. Transformation of the French Demographic Landscape 1806-1906. Oxford England Clarendon Press.
Gravier, Jean-François. 1947. Paris et le désert français: décentralisation, équipement, population. Flammarion.
Haines, Michael R. 2001. “The Urban Mortality Transition in the United States, 1800-1940.” Annales de Démographie Historique (1): 33-64.
Preston, S. H., & Van de Walle, E. 1978. Urban French mortality in the nineteenth century. Population studies, 32(2), 275-297.
Robine, Jean-Marie. 2001. “Redéfinir les phases de la transition épidémiologique à travers l’étude de la dispersion des durées de vie : le cas de la France.” Population (French edition): 199-221.
Note
¹ Seine was a département encompassing Paris and its immediate suburbs. It was abolished in 1968 and its territory divided among four new departments. In this text, Seine refers to the current départements 75, 92, 93, 94.