

Population stabilization in India is of obvious global significance. According to the latest census, India’s population was 1,210 million in 2011, accounting for 17 percent of the global population; if current trends continue, India will become the world’s most populous country in 2022.
India’s total fertility rate (TFR) has declined steadily, falling from 3.6 in 1991 to 2.4 by 2011. Over the same period, per capita income increased from 1221 US$ to 3755 US$. The increase in national income has not only yielded substantial reductions in poverty, but has also been accompanied by major improvements in female literacy and child survival. The female literacy rate increased from 39 percent in 1991 to 65 per cent in 2011; under-five mortality declined to 55 per 1,000 live births in 2011. In the composite index of human development that combines education, health and income, the country increased its score from 0.428 in 1990 to 0.609 by 2014 (UNDP 2015).
The very positive recent national trends conceal large differences across states, regions and districts of India. As of the 2011 census, India comprises 29 states and six union territories spread across 640 districts. Conventional demographic analyses examine the pattern and determinants of fertility change using four proximate determinants, namely, contraception, marriage, induced abortion and postpartum insusceptibility at state level or at individual level. The average population size of an Indian district is about two million, with large variations in fertility and developmental parameters. Disaggregated analyses at district level are useful for multiple stakeholders as districts are the central focus of planning and program implementation in India. Such analyses could also shed light on the puzzling decrease in fertility levels despite a recent decline in use of modern contraception in eight of the 15 states of India (IIPS 2016).
No evidence of fertility convergence at the district level
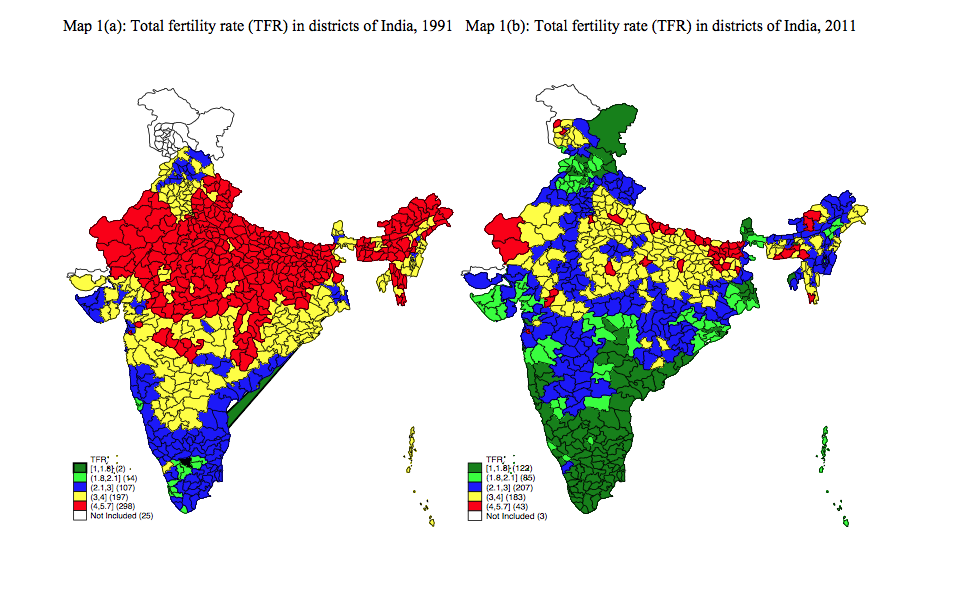
Fertility convergence implies that fertility declines faster in high fertility areas than in low fertility areas. Maps 1 and 2 present the fertility levels recorded in districts of India in 1991 and 2011. In 2011, the TFR varied widely across districts of India; from 5 births per woman in Khagaria district in the state of Bihar to 1.1 in Kolkata district in the state of West Bengal. While one-fifth of the districts had reached a below-replacement level of fertility by 2011, about half of the districts had a TFR of more than 3.
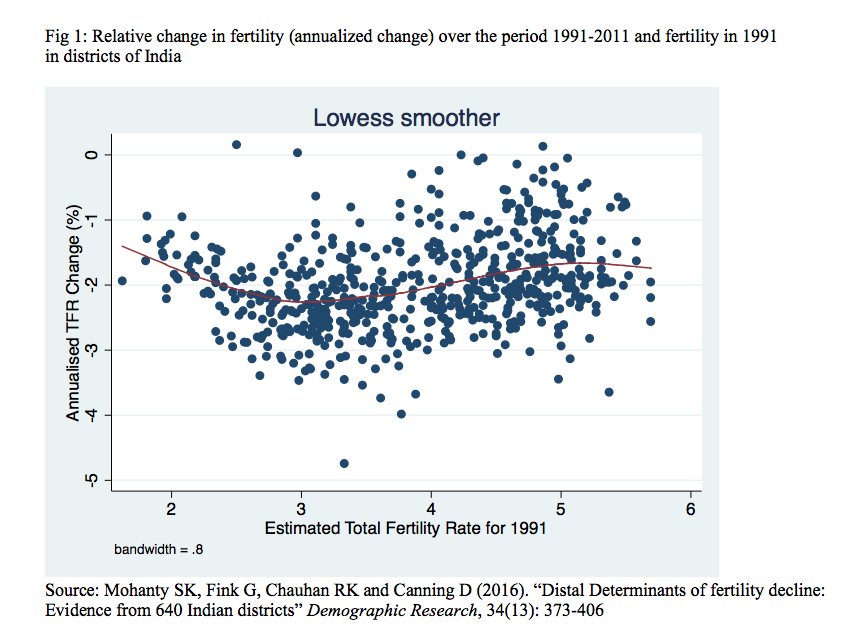
Figure 1 shows average annual declines in TFR relative to the initial 1991 TFR levels at the district level. While most districts experienced substantial declines over the 1991-2011 period, there was no clear relationship between initial levels and subsequent changes; on average, the largest relative reductions were observed for districts with an initial TFR in the middle (3-4) range.
Pace of socio-economic change: female literacy, under-five mortality and poverty
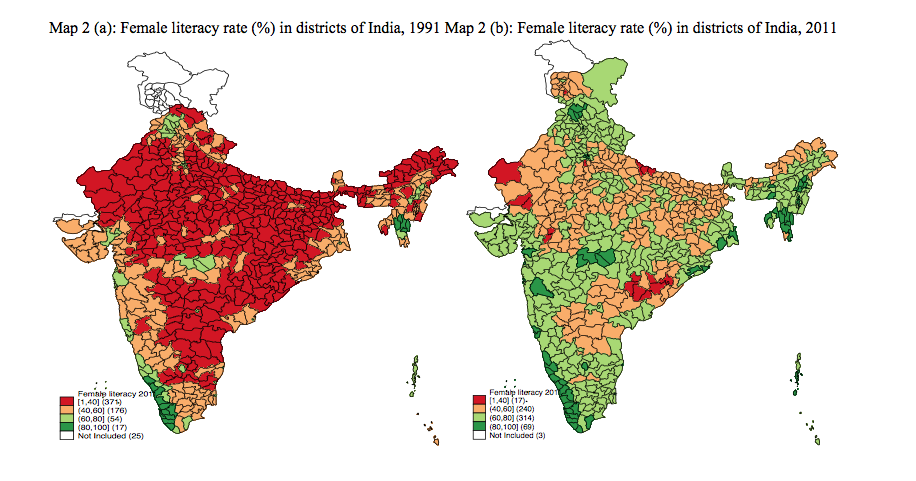
Socio-economic change has been consistently highlighted as a key predictor of fertility change. Among other factors, the extant literature has shown that female literacy, under-five mortality and poverty are of critical importance. Female educational attainment is associated with increasing use of contraception, increasing age at marriage, and birth spacing. Maps 2(a) and 2(b) present female literacy rates at the district level for 1991 and 2011, respectively. Overall, tremendous progress in female literacy has been achieved in the last two decades, which probably triggered fertility reduction. Very low female literacy (less than 40% of women able to read and write), which was widespread in 1991 (60% of all districts) had become rare by 2011 (less than 3% of all districts). Most districts have female literacy in the range of 60-80 percent.
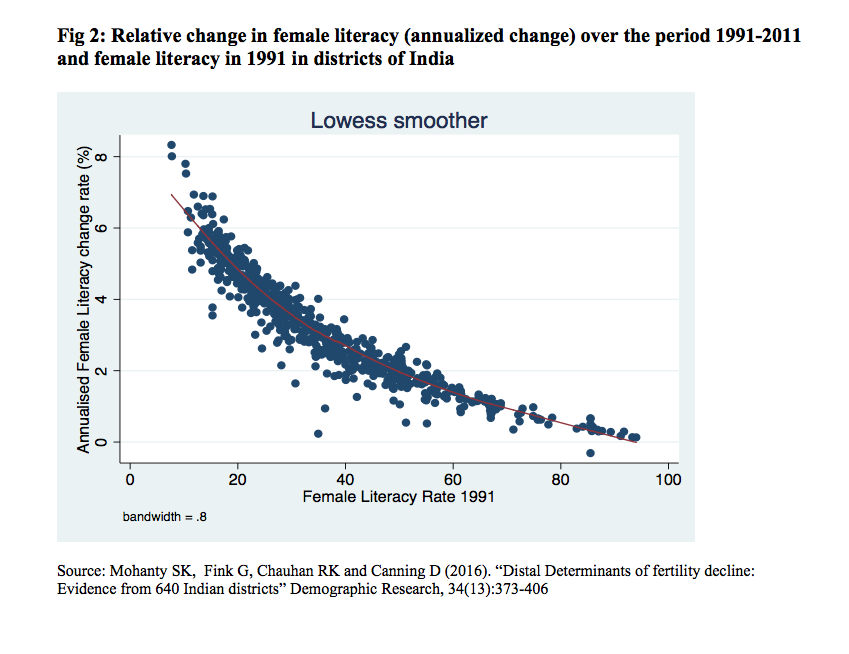
Fig 2 plots the change in female literacy by level of initial female literacy in districts of India. The negative sign of the slope and the convex nature of the curve indicate remarkable convergence in female literacy, with greater progress observed in the districts that most lagged behind in 1991.
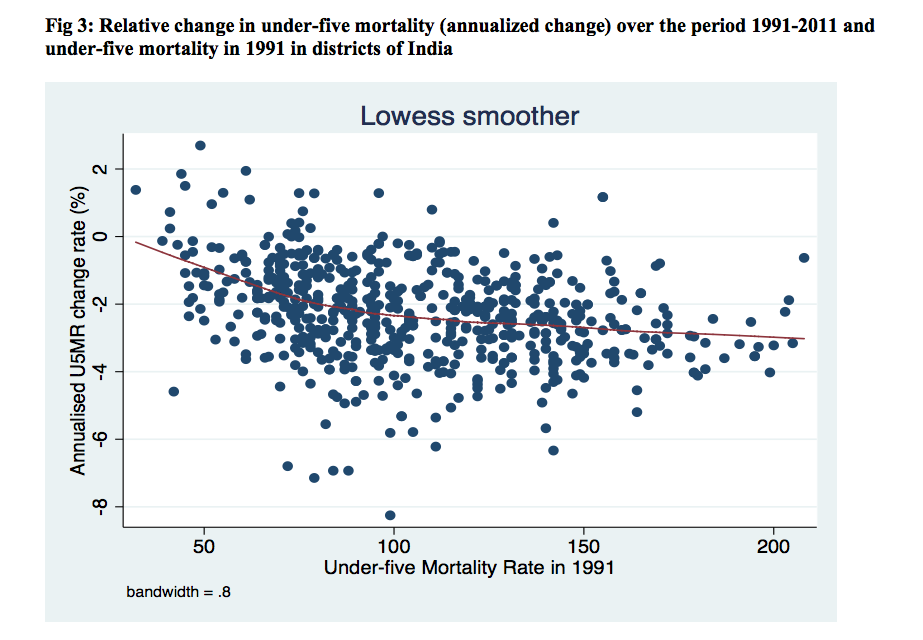
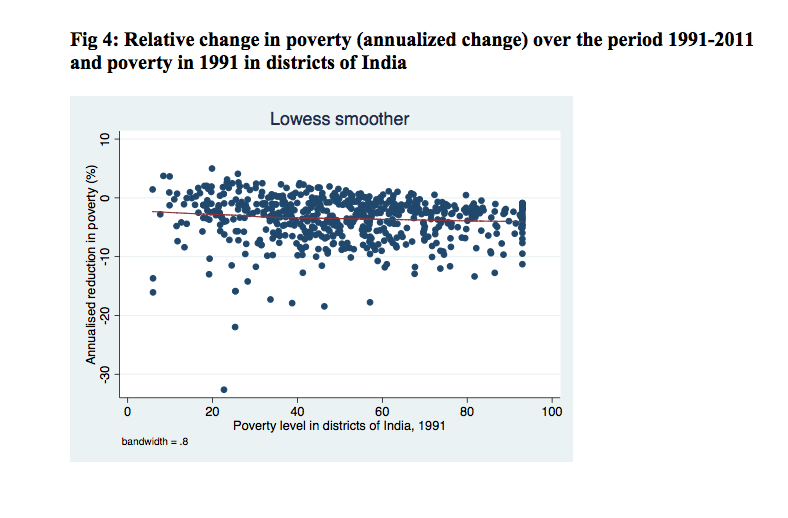
Fig 3 plots the convergence in under-five mortality across districts of India. Districts with higher under-five mortality have generally shown a greater reduction in the last two decades; the convergence in under-five mortality is undoubtedly higher than that of fertility. However, the same does not hold for poverty: in this case the trajectories were heterogeneous and bore little relation to the starting point.When jointly analyzing poverty, literacy and mortality in multivariable models (not shown here), we found literacy to be the factor most predictive of changes in fertility; strong associations were also found between child mortality and changes in fertility, while the associations found with poverty were relatively minor and often not statistically significant.
Conclusion
Fertility differentials across districts of India are large. While fertility has declined in virtually all areas of India, evidence on convergence in fertility is limited, with a surprisingly large number of districts still having TFR of 4 and higher. High TFR rates in these districts, together with the generally young population, will continue to drive rapid population growth. Regional differences in population growth are likely to widen regional imbalances, increasing regional inequality and inter-state migration. Focusing on areas with high fertility will be critical; increasing access to modern methods of contraception, improving child survival and promoting female education in high-fertility districts are all potentially effective strategies for reaching this goal.
References
IIPS (2016). National Family and Health Survey. 2015-16. State Fact Sheet
Mohanty SK, Fink G, Chauhan RK and Canning D (2016). “Distal Determinants of fertility decline: Evidences from 640 Indian districts” Demographic Research, 34(13):373-406
UNDP (2015). Human Development Report 2015, New York: USA