

Compared to other high-income countries, the United States has lower life expectancy and greater age-specific mortality variability, due in part to a higher concentration of deaths at young ages. Justin M. Vinneau, Richard G. Rogers, Robert A. Hummer, and Elizabeth M. Lawrence conclude that reducing early life mortality is key to narrowing the life expectancy and mortality variability gaps of the United States with respect to other countries.
Mortality variability
Relative to peer countries of the Organization for Economic Cooperation and Development (OECD), the United States has higher age-specific mortality rates and a lower life expectancy (Avendano & Kawachi, 2014). Between 1980 and 2016, the ranking of the United States relative to 16 high-income peers worsened for nearly every five-year age-specific mortality category (Rogers et al., 2020b), and by 2016 the United States ranked last in mortality rates for all 5-year age groups between ages 0 and 74. While understanding where American life expectancy stands relative to peer countries is extremely important, another key component of the mortality disadvantage is mortality variability. To measure mortality variability, we employed the intercentile range (ICR) of survivorship (Rogers et al. 2020b; see also van Raalte et al., 2018; Wilmoth & Horiuchi 1999), which provides valuable insights about mortality in early life and at very old ages. The ICR is based on period life table data and thus reflects mortality variability in a country for a particular year. The lower bound of the ICR identifies the age at which 1% of a country’s population has died, and the upper bound the age at which 99% has died. The lower bound of the ICR is a good indicator of how well a country prevents deaths in early life. Deaths at young ages are potentially avoidable, as they are often caused by external factors. Further, countries with fewer early deaths tend to exhibit less mortality variability.
Sex differences in ICR lower bounds
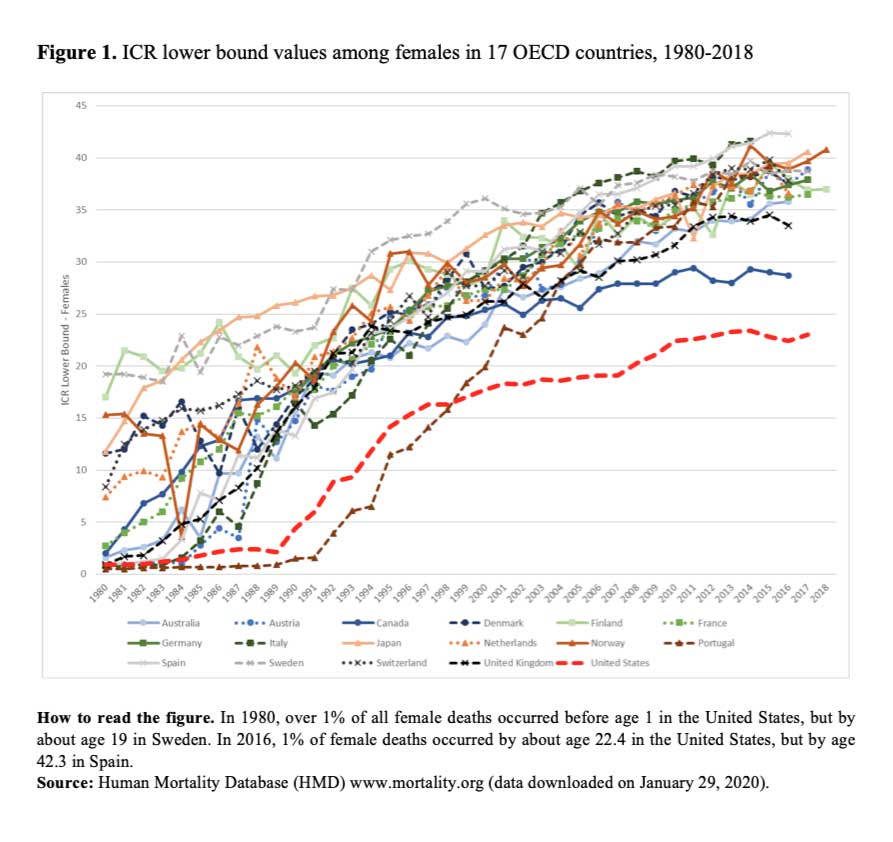
The United States does remarkably well at the oldest ages when compared to 16 OECD peer nations. Unfortunately, this is not the case at the lower bound. The lower bound values of the ICR are shown in Figure 1 for females and in Figure 2 for males. In 1980, many countries were characterized by lower bound values of less than 5 years, often hovering near age 0, reflecting relatively high infant mortality. Beginning with Figure 1, we see that all countries except the United States and Portugal began to see dramatic improvements in their female lower bound values by 1987. It took an additional two years for the United States to see a similar, albeit attenuated, increase. After a decade of improvement, the United States began to plateau and experienced a lower bound crossover with Portugal, the only country among the 17 with a value below that of the United States. From the late 1990s through 2016, peer OECD countries enjoyed noteworthy growth in their lower bound values, thus continuing to exhibit improvement. Across this same period, American females saw only modest improvement, and by 2012 their lower bound had levelled off at about age 23. Indeed, as of 2016, the United States was the only one of these 17 OECD nations with a female ICR lower bound below 25 years. In contrast, Spain’s lower ICR bound for females was over 40 years.
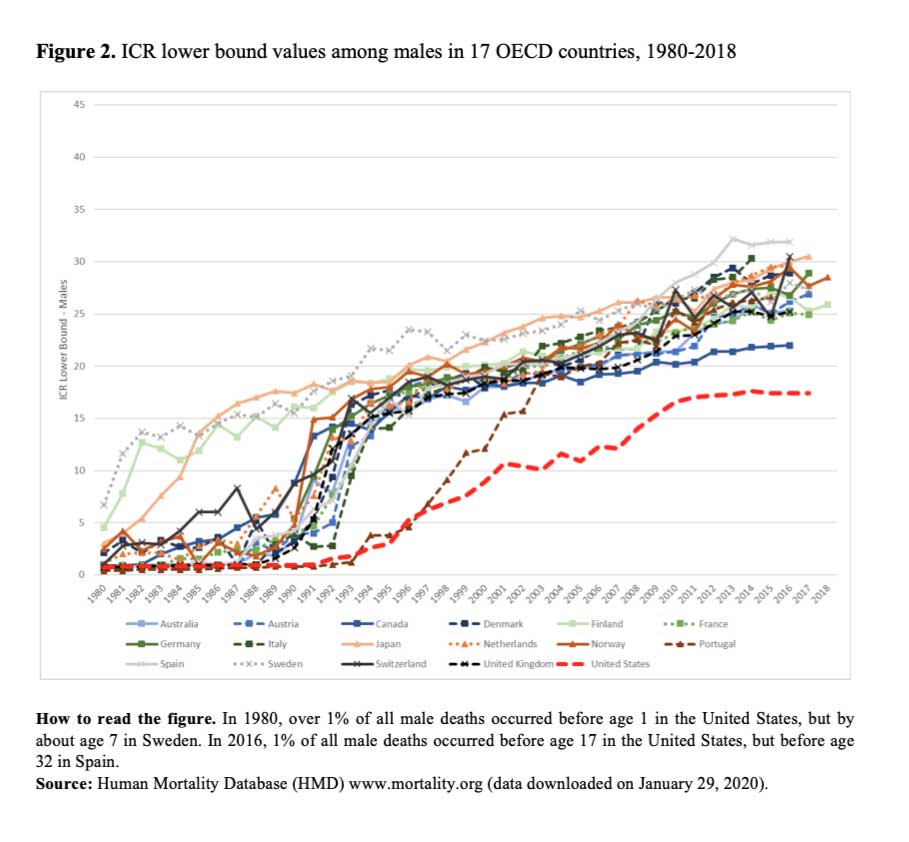
As with females, Figure 2 reveals that the ICR lower bound for males in most countries in 1980 was below age 5, and often near age 0, reflecting relatively high rates of infant mortality. Despite rapid improvement across time, male gains were smaller and slower than those of females. While females saw substantial improvements in all 17 countries beginning in 1987, it took an additional 4 to 5 years for males to see a similar rise. However, this improvement was not only later for males in the United States, but also less pronounced. By 1996, and after crossing over with Portugal, the United States was still in last place among its 16 peer nations in ICR lower bound values. After 1996, the United States saw modest improvements which however plateaued in 2010. For the following six years, the United States’ ICR lower bound for males hovered around 17 years, showing no signs of improvement. In addition to this stagnation, the United States is the only country where males have an ICR lower bound below 20 years in 2016, compared with over 30 years in Spain. Across countries, the lower bound range is smaller for males than females; it peaks near 43 years for females, compared to about 32 years for males. Thus, regardless of country, males experience a greater proportion of early-life deaths than females.
The significance of mortality variability for policy and research
The United States performs poorly in measures of longevity relative to its high-income peer nations. We build upon this well-documented finding by showing that the United States has a disproportionate number of deaths concentrated in early life for both males and females relative to 16 peer OECD nations. The higher level of mortality variation within the United States has the potential to create social, behavioral, and psychological uncertainty among its residents, especially disadvantaged subpopulations, thereby adversely impacting quality of life (see Aburto et al., 2020). For policy to improve mortality outcomes, decrease lifespan variability, and diminish inequalities by sex and across other sociodemographic groups, interventions in the United States should seek to:
- prevent accidents in early life;
- improve access and quality of pre- and post-natal care;
- mitigate risk factors specific to male early life mortality;
- reduce social and economic inequalities that are strongly related to American early life mortality by race/ethnicity, socioeconomic status, and family structure (Braudt et al. 2019; Fishman et al. 2020; Rogers et al. 2017; Rogers et al. 2020a).
Targeted interventions focused on males and on reducing social and economic inequalities in early life may also help to reduce life span inequalities by sex, socioeconomic status, and race/ethnicity. A clear and compassionate way to close the life expectancy and mortality variability gaps between the United States and other high-income countries would be for the United States to substantially reduce early life mortality, especially among its most vulnerable populations.
COVID-19 is undoubtedly raising age-specific mortality rates and reducing life expectancy in the United States; it is also exerting great strains on health infrastructure and the economy. With the possibility of rising mortality in the older segments of the population, a decreasing upper bound of the ICR may reduce mortality variability without improving the lower bound. It is essential that life expectancy and multiple measures of mortality variability continue to be monitored in the context of the global COVID-19 pandemic.
References
Aburto, J. M., Floridi, G., & Fegitz, E. (2020). On the (changing) relationship between life expectancy and lifespan inequality. N-IUSSP.
Avendano, M., & Kawachi, I. (2014). Why do Americans have shorter life expectancy and worse health than do people in other high-income countries? Annual Review of Public Health, 35: 307–325. doi:10.1146/annurev-publhealth-032013-182411.
Braudt, D.B., Lawrence, E.M., Tilstra, A.M., Rogers, R.G., & Hummer, R.A. (2019). Family socioeconomic status and early life mortality risk in the United States. Maternal and Child Health Journal, 23(10), 1382-1391.
Fishman, S.H., Hummer, R.A., Powers, D.A., Sierra, G., Hargrove, T.W., & Rogers, R.G. (2020). Race/Ethnicity, maternal educational attainment, and infant mortality in the United States. Biodemography and Social Biology (forthcoming).
Rogers, R.G., Hummer, R.A., Tilstra, A.M., Lawrence, E.M., & Mollborn, S. (2020a). Family structure and early life mortality in the United States. Journal of Marriage and the Family, 82(4), 1159-1177.
Rogers, R. G., Hummer, R. A., Vinneau, J. M., & Lawrence, E. M. (2020b). Greater mortality variability in the United States in comparison with peer countries. Demographic Research, 42(36), 1039-1056. doi: 10.4054/DemRes.2020.42.36
Rogers, R.G., Lawrence, E., Hummer, R.A., & Tilstra, A. (2017). Racial/Ethnic differences in early life mortality in the United States. Biodemography and Social Biology, 63(3), 189-205.
van Raalte, A. A., Sasson, I., & Martikainen, P. (2018). The case for monitoring lifespan inequality. Science, 362(6418): 1002–1004. doi:10.1126/science.aau5811.
Wilmoth, J. R., & Horiuchi, S. (1999). Rectangularization revisited: Variability of age at death within human populations. Demography, 36(4): 475–495. doi:10.2307/2648085.