Taking a broader and more long-term perspective on the effects of the Covid-19 pandemic on life expectancy may help scholars and policy makers to assess its true impact, and the role of countermeasures, starting with vaccination. Stefano Mazzuco and Stefano Campostrini contend that their effect is greater than may appear locally or in the short run.
The striking effect of the Covid-19 pandemic on world mortality in 2020 has been highlighted by several studies, among which Aburto et al (2021) and ourselves (Mazzuco and Campostrini 2022).
Here we use the same data as our 2022 study (the short-term mortality fluctuation data series of the Human Mortality Database) to compare mortality levels in 2019 (before the Covid-19 pandemic) and 2021. Moreover, for the same countries, we calculate the weekly life expectancy, as Trias-Llimos et al (2021) did for 2020, to show the periods of 2021 when excess mortality (if any) occurred. Finally, we study the association of the 2019-2021 difference in weekly life expectancy with the properly lagged vaccination rate in the same countries. Data on vaccination rates are taken from Our World in Data, following Schoeley et al (2022).
Several patterns
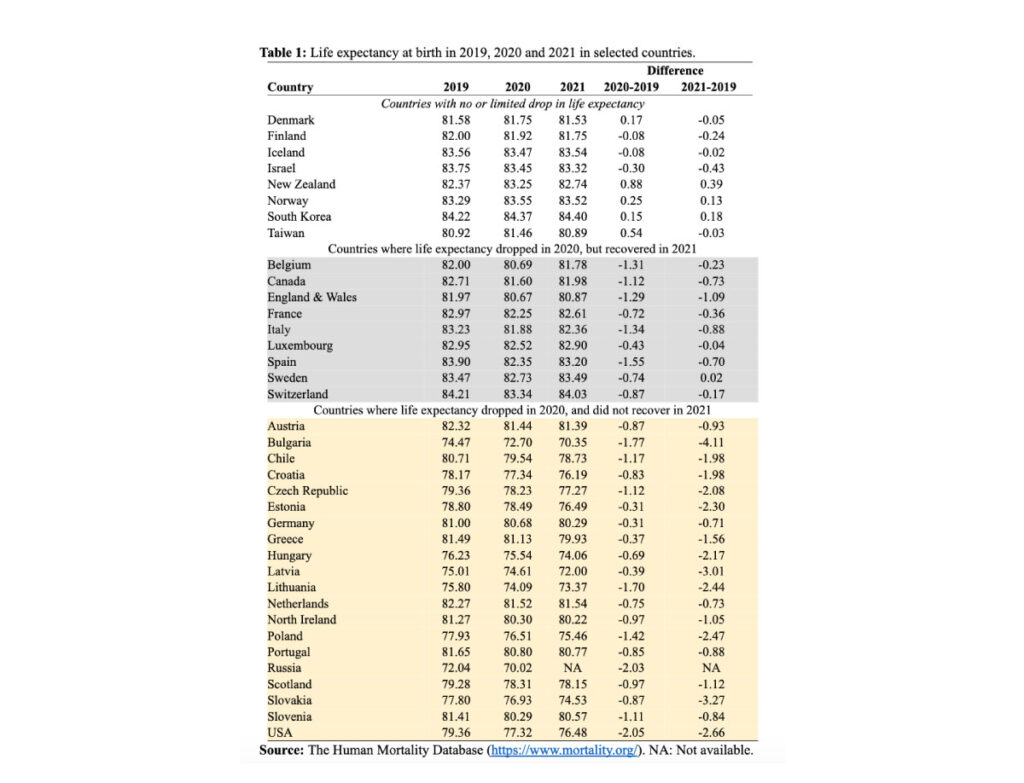
Table 1 reports the estimates of life expectancy loss in 2020 and 2021, evidencing particularly high losses in several countries in 2020, as already shown by Aburto et al (2021) and Mazzuco and Campostrini (2022). The figures for 2021 show several clusters: some countries (Denmark, Iceland, Norway, New Zealand, South Korea and Taiwan) had no life expectancy decline either in 2020 or in 2021, or a very moderate one (Israel and Finland). Others (Belgium, Canada, England and Wales, France, Italy, Netherlands, Spain, Sweden, Switzerland) fully or partially recovered from the 2020 decline. However, in several countries, the 2020 survival decline was not followed by a recovery in 2021, a year which, in some cases, proved even worse. This is the case of many eastern European countries (especially Bulgaria), Scotland, North Ireland, Greece and, to a lesser extent, Germany. The U.S.A. suffered a severe decline in life expectancy in 2020, and things did not improve in 2021. For Russia, data for 2021 are not yet available.

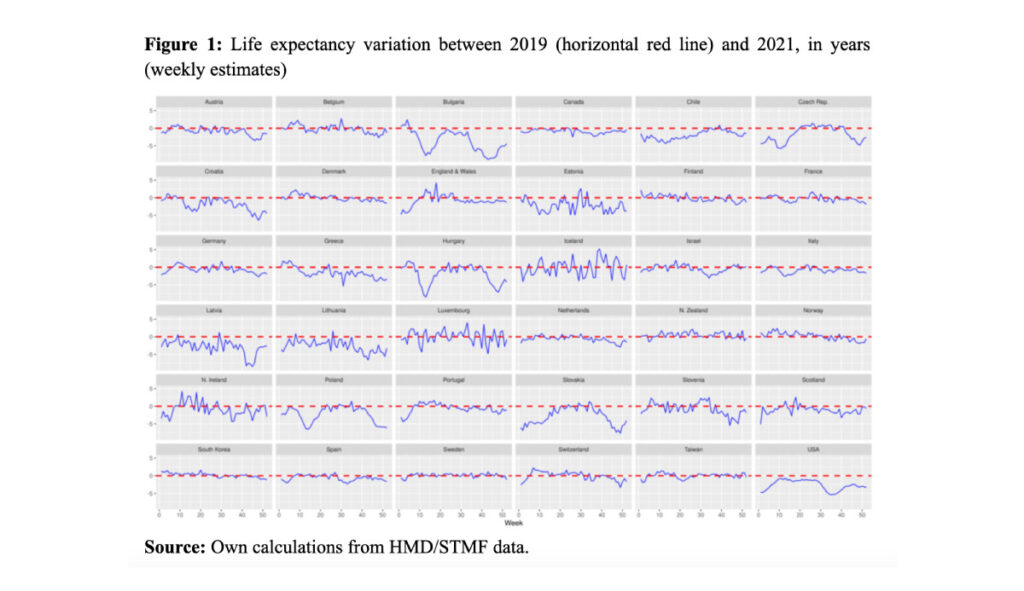
These figures result from several waves of the epidemic. At the beginning of 2021, many countries were in the tail of the so-called second wave; a third wave, characterized by the Beta variant, took place in the first half of the year, while a fourth wave started towards the end of 2021. These waves did not hit all countries simultaneously, which explains part of the observed variability, alongside differences in climate conditions and mitigation measures (Figure 1).

In some countries (e.g. UK, Czech Republic, Portugal, Slovak Republic), the decline in life expectancy is attributable to excess mortality in the first part of the year, during the second or third wave. In others (e.g. Austria, Bulgaria, Latvia, Slovenia, USA), substantial excess mortality occurred towards the end of the year, when the fourth wave was at its height.
The role of Covid-19 vaccination
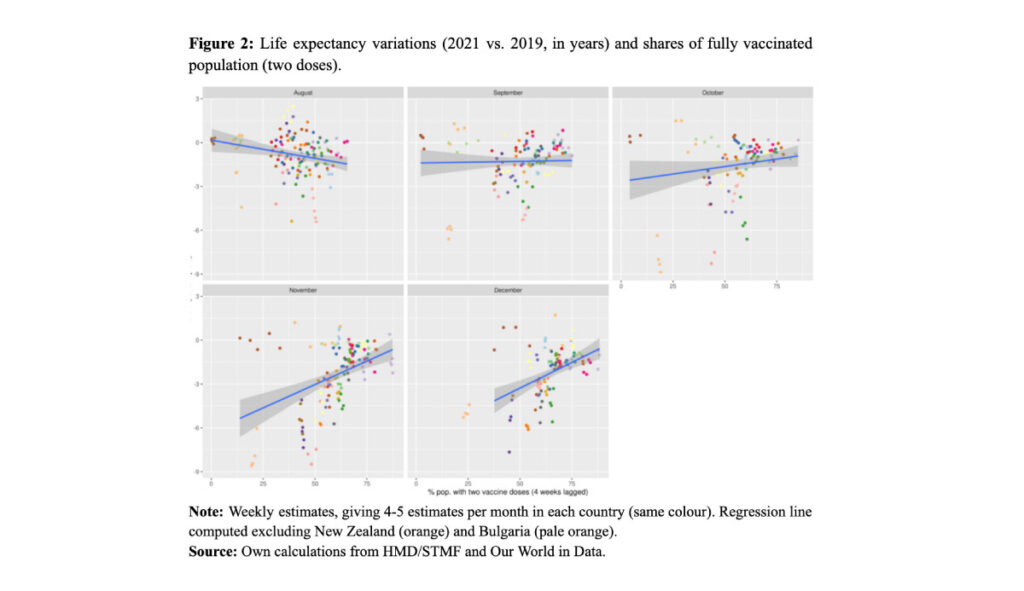
Towards the end of 2021, vaccination coverage was probably crucial for many countries. Earlier, it was probably effective only in countries – such as the UK and Israel – that began their vaccination campaign earlier. However, the vast majority of the countries considered here started to reach effective levels of vaccination coverage between June and September 2021, when the diffusion of Covid was rather low. In Figure 2, we report a month-specific scatterplot of variations in life expectancy (weekly estimates) and the four-week lagged shares of fully vaccinated population.

The blue regression line drawn in the figures was calculated excluding values from Bulgaria and New Zealand, which appear to be outliers. New Zealand is a peculiar case: despite a low vaccination rate, its relative isolation from rest of the world helped to contain the number of Covid-related deaths. Conversely, Bulgaria also has low vaccination coverage, but a particularly high life expectancy decline. Globally, the panels of Figure 2 clearly show that the association between life expectancy drop and vaccination rate changed over time, from slightly negative in August to strongly positive in November and December.
There may be two concurring explanations for this increasing relationship:
1) vaccination coverage needs to be above a certain threshold (40-50%) to start showing its benefit in terms of mortality;
2) its effect on mortality increases (protecting countries where coverage is higher) when the pandemic is stronger (during the “waves”), and decreases during summer, when the virus is less prevalent.
The case of USA is emblematic. While vaccination started earlier and was rolled out faster than in several other countries, in the second part of 2021 coverage increased slowly, reaching about 50-60% only at the end of the year and ending with a mere 62.7% of the population fully vaccinated. Conversely, Italy, after experiencing strong excess mortality in 2020, started its vaccination campaign quite late, but eventually covered around 80% of the population. We posit that this explains, at least in part, the different performance of the two countries: between 2019 and 2021, the USA lost more than 2 years of life expectancy, and Italy only 0.88 years.
Public health implications
The study of life expectancy makes it possible to analyse and compare the effect of the Covid-19 pandemic on mortality in different countries, net of different age structures. By 2020, the differences were all solely attributable to how far the pandemic had penetrated the different countries, while the data for 2021, especially the second part of the year, show above all the effect of vaccination campaigns. This longer view helps to better assess the effects of the pandemic and of the countermeasures adopted by governments. Vaccines, for instance, prove effective, but only above a certain threshold level, when some two-thirds of the population are covered. And in some cases, they have been so effective as to bring life expectancies back to their pre-pandemic levels.
References
Aburto J.M., Schöley J., Kashnitsky I., Zhang L., Rahal C., Missov T. I. , Mills M. C , Dowd J. B. , Ridhi Kashyap, 2021 Quantifying impacts of the COVID-19 pandemic through life-expectancy losses: a population-level study of 29 countries, International Journal of Epidemiology, 2021;, dyab207, https://doi.org/10.1093/ije/dyab207
Human Mortality Database, University of California, Berkeley (USA), and Max Planck Institute for Demographic Research (Germany) (2021) Available at www.mortality.org, Last accessed on 2022-06-27.
Mathieu, E., Ritchie, H., Ortiz-Ospina, E. et al. (2021) A global database of COVID-19 vaccinations. Nat Hum Behav
Mazzuco S., Campostrini S. (2022) Life expectancy drop in 2020. Estimates based on Human Mortality Database. PLoS ONE 17(1): e0262846. https://doi.org/10.1371/journal.pone.0262846
Schöley J., Aburto JM, Kashnitsky I, Kniffka MS, Zhang L, Jaadla H, Dowd JB, Kashyap R (2022) Bounce backs amid continued losses: Life expectancy changes since COVID-19 medRxiv 2022.02.23.22271380; doi: https://doi.org/10.1101/2022.02.23.22271380
Trias-Llimós S, Riffe T, Bilal U (2020) Monitoring life expectancy levels during the COVID-19 pandemic: Example of the unequal impact of the first wave on Spanish regions. PLOS ONE 15(11): e0241952. https://doi.org/10.1371/journal.pone.0241952
Source tab 1: The Human Mortality Database.


